Fig. 4
Download original image
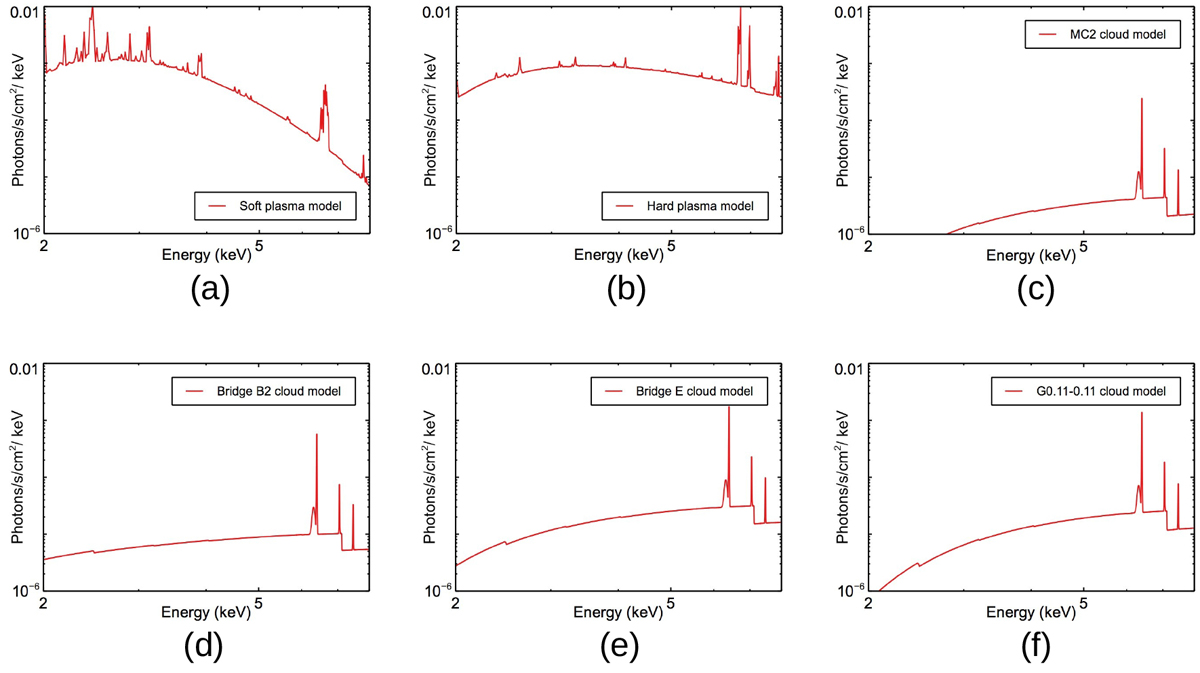
Spectral models for the emission components of our simulations: the soft (a) and the hard (b) plasma in the nominal FOV, and the reflection in the MC2 (c), Bridge B2 (d), Bridge E (e), and G0.11-0.11 (f) region. The models were obtained from the Chandra spectral analysis performed in the present work and in Di Gesu et al. (2020).
Current usage metrics show cumulative count of Article Views (full-text article views including HTML views, PDF and ePub downloads, according to the available data) and Abstracts Views on Vision4Press platform.
Data correspond to usage on the plateform after 2015. The current usage metrics is available 48-96 hours after online publication and is updated daily on week days.
Initial download of the metrics may take a while.