Fig. 3
Download original image
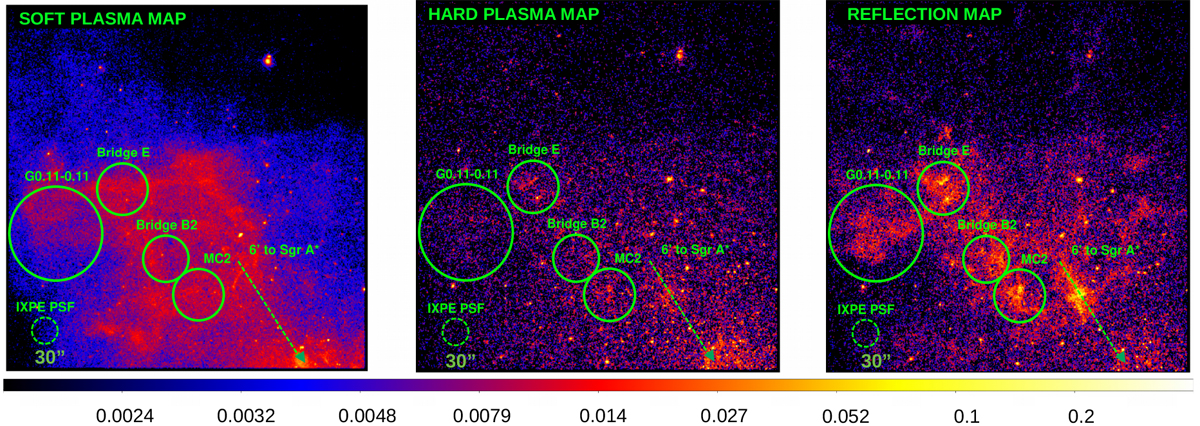
Background- and continuum-subtracted, merged Chandra maps of the soft plasma, the hard plasma, and the reflection components in the Sgr A MC complex region centered on the nominal IXPE pointing (shown from left to right). The images are smoothed using a 3 pixel Gaussian kernel. The color bar displayed on the bottom has adimensional units because the images are normalized to the maximum value. The regions shown in the solid circles are the MC considered for IXPE simulations (i.e., MC2, Bridge B2, Bridge E, and G0.11-0.11). A dashed circle having the size of the IXPE PSF is shown for comparison. The direction to Sgr A* is indicated with a dashed arrow.
Current usage metrics show cumulative count of Article Views (full-text article views including HTML views, PDF and ePub downloads, according to the available data) and Abstracts Views on Vision4Press platform.
Data correspond to usage on the plateform after 2015. The current usage metrics is available 48-96 hours after online publication and is updated daily on week days.
Initial download of the metrics may take a while.