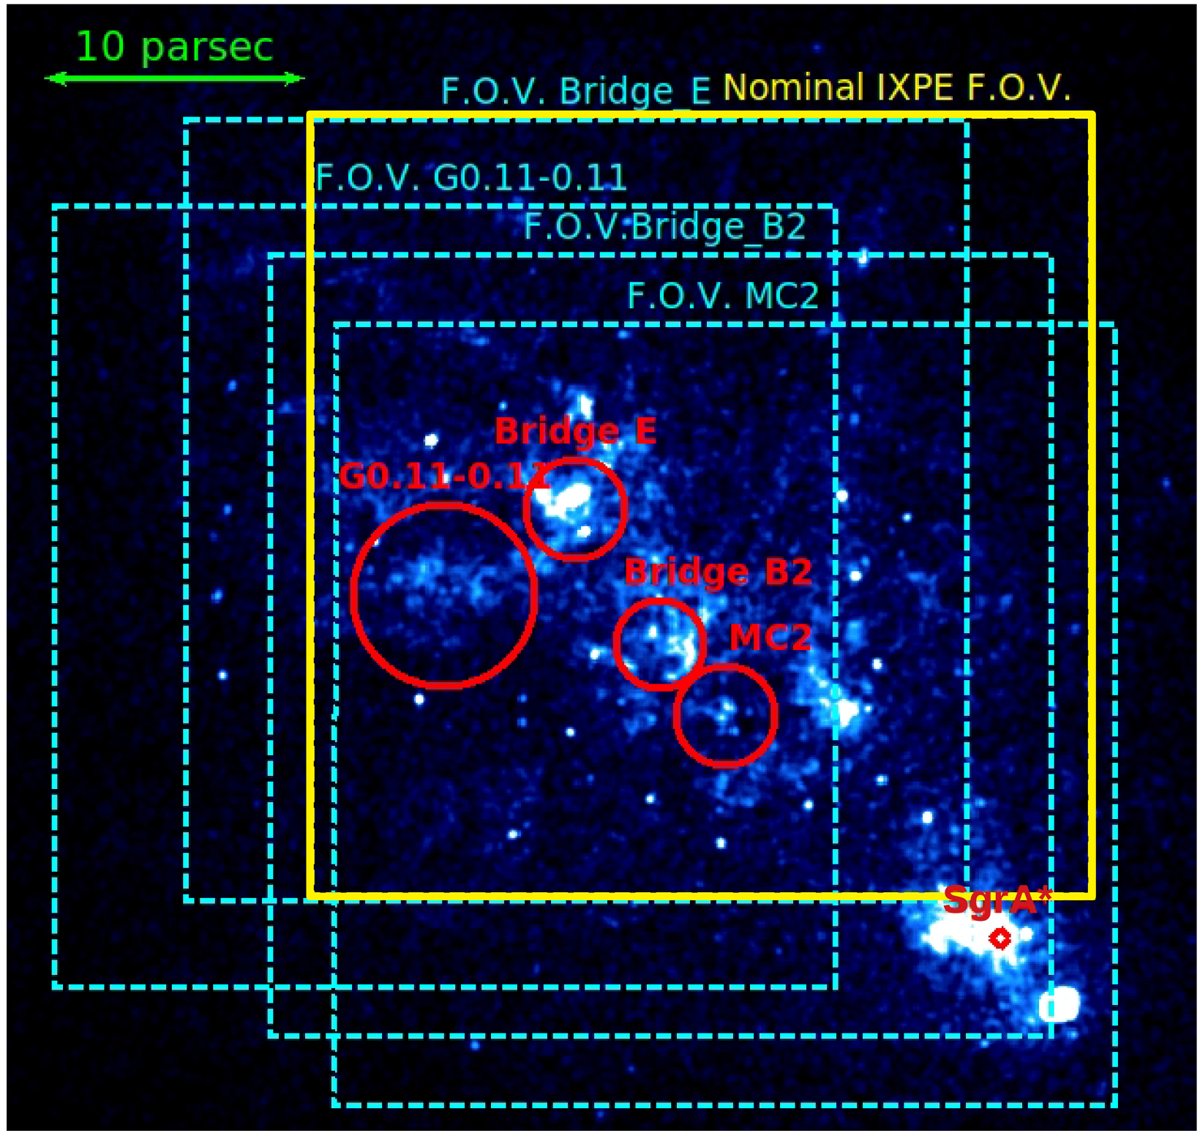
Fig. 2
Download original image
Chandra Fe Kα map of the Sgr A complex. The dashed boxes are the FOVs considered in the analysis of Sect. 3.2, while the solid box represent the nominal IXPE FOV of our baseline simulation. The circles display the clouds considered in this work, while the diamond marks the position of Sgr A*. The double-headed arrow represents a distance of 10 pc.
Current usage metrics show cumulative count of Article Views (full-text article views including HTML views, PDF and ePub downloads, according to the available data) and Abstracts Views on Vision4Press platform.
Data correspond to usage on the plateform after 2015. The current usage metrics is available 48-96 hours after online publication and is updated daily on week days.
Initial download of the metrics may take a while.