Fig. 5.
Download original image
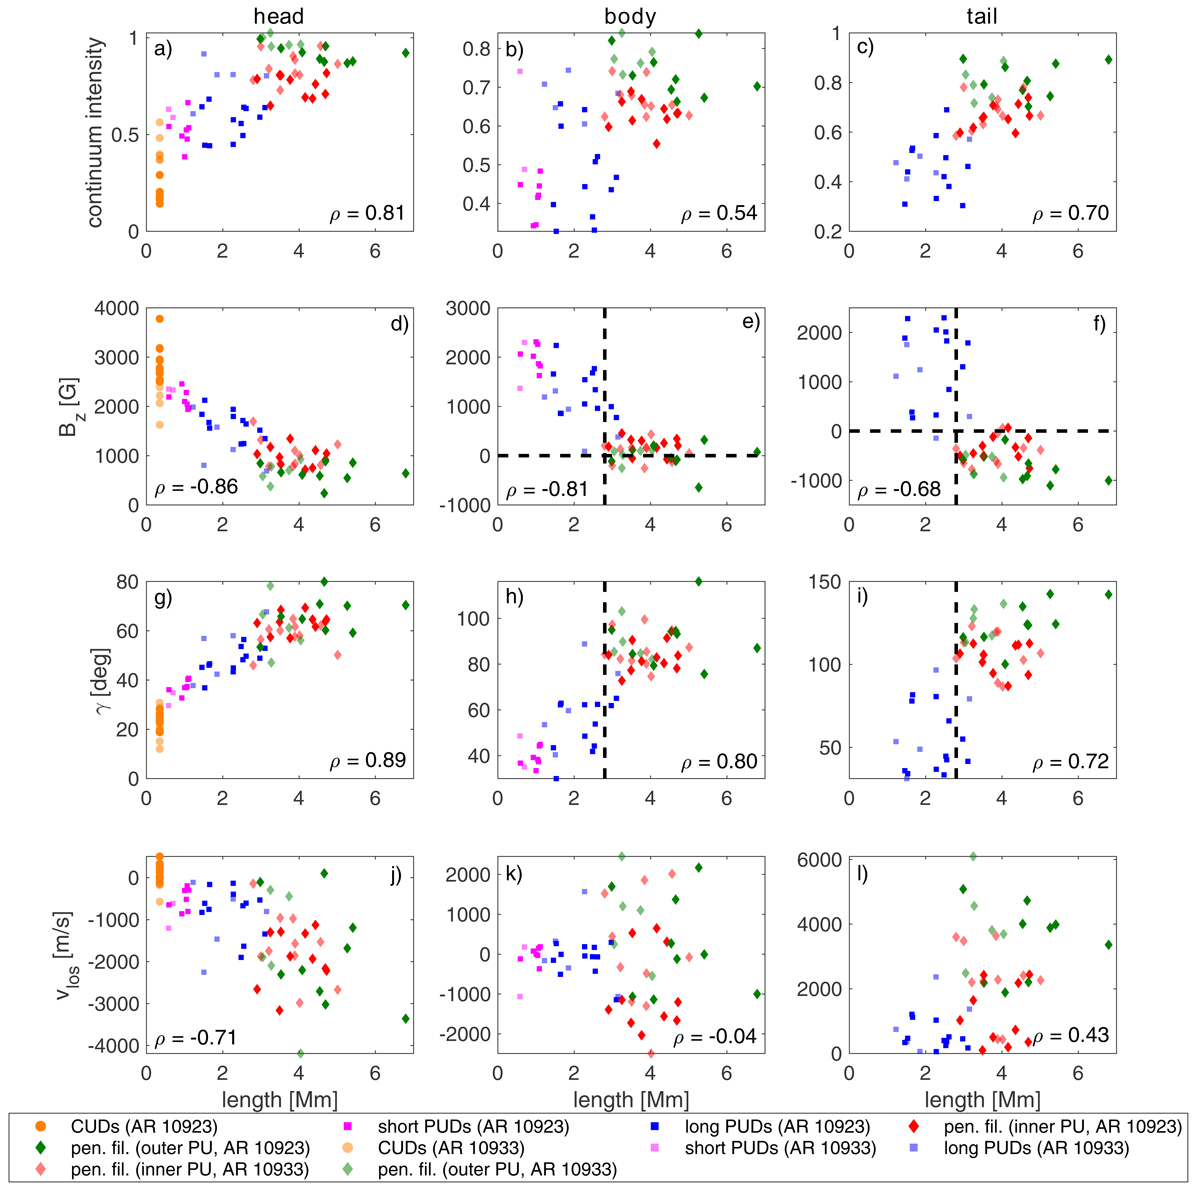
Scatter plots of various observables as a function of the length of the individual features for both sunspots. Each data point represents one feature and is an average along the main axis over the head (left column), the body (center column), or the tail (right column) of the feature. These regions are separated by the white vertical lines in Fig. 3. From top to bottom: continuum intensity, vertical magnetic field, inclination of the magnetic field, and line-of-sight velocity. The colors represent the following features: CUDs (orange), short PUDs (purple), long PUDs (blue), penumbral filaments in the inner penumbra (red), and penumbral filaments in the outer penumbra (green). The solid symbols show the results for AR 10923 and the transparent ones for AR 10933. We also show in each panel the correlation coefficient, ρ, between the respective physical quantity and the length of the features. We do not distinguish between the different types of features when computing the correlation coefficient. Since the short PUDs do not exhibit tails, we only separate between the head and the body of these features. The CUDs resemble the heads of the penumbral filaments, so we include these features only in the left column. We average the CUDs in a region of 3 × 3 pixels around their centers (as indicated by the dashed white squares in the left column of Fig. 3). Since many of the CUDs are not fully resolved in the Hinode data, we assigned a length of 3 pixels (∼350 km) to each of them.
Current usage metrics show cumulative count of Article Views (full-text article views including HTML views, PDF and ePub downloads, according to the available data) and Abstracts Views on Vision4Press platform.
Data correspond to usage on the plateform after 2015. The current usage metrics is available 48-96 hours after online publication and is updated daily on week days.
Initial download of the metrics may take a while.