Fig. 4.
Download original image
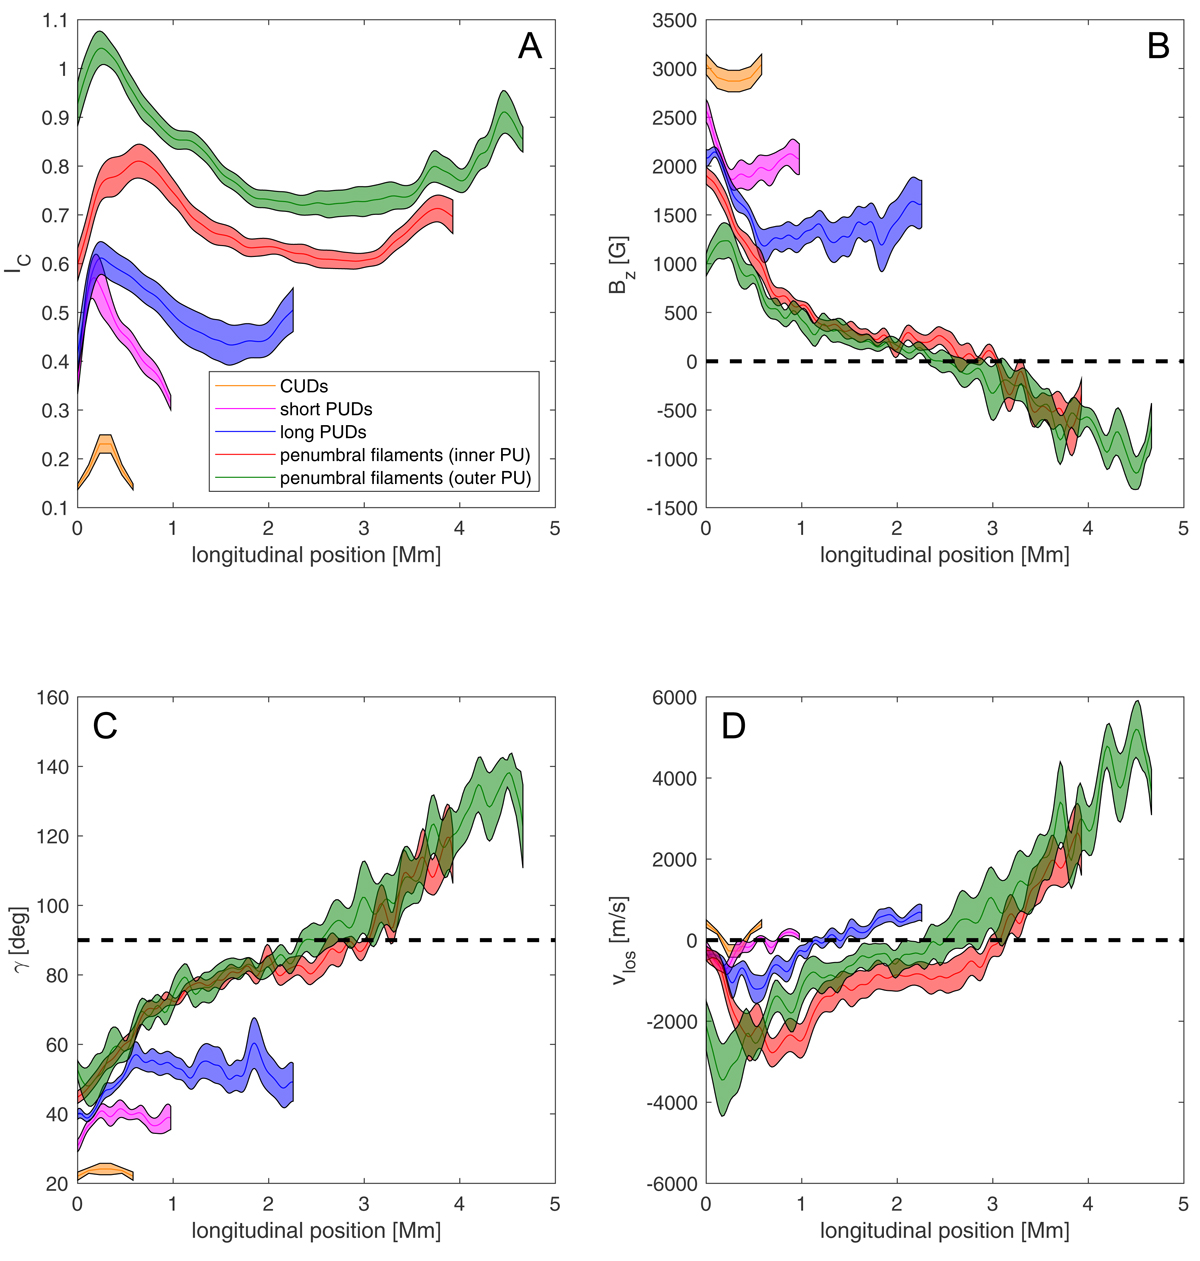
Cuts along the central axis of the ensemble averages of the different types of features in AR 10923 shown in Fig. 3 for various observables. For the CUDs, we performed an azimuthal average. Panel A: continuum intensity. Panel B: vertical magnetic field. Panel C: inclination of the magnetic field. Panel D: line-of-sight velocity. The colored symbols indicate the following features: CUDs (orange), short PUDs (purple), long PUDs (blue), penumbral filaments in the inner penumbra (red), and penumbral filaments in the outer penumbra (green). The shaded areas indicate the 1σ error of the mean.
Current usage metrics show cumulative count of Article Views (full-text article views including HTML views, PDF and ePub downloads, according to the available data) and Abstracts Views on Vision4Press platform.
Data correspond to usage on the plateform after 2015. The current usage metrics is available 48-96 hours after online publication and is updated daily on week days.
Initial download of the metrics may take a while.