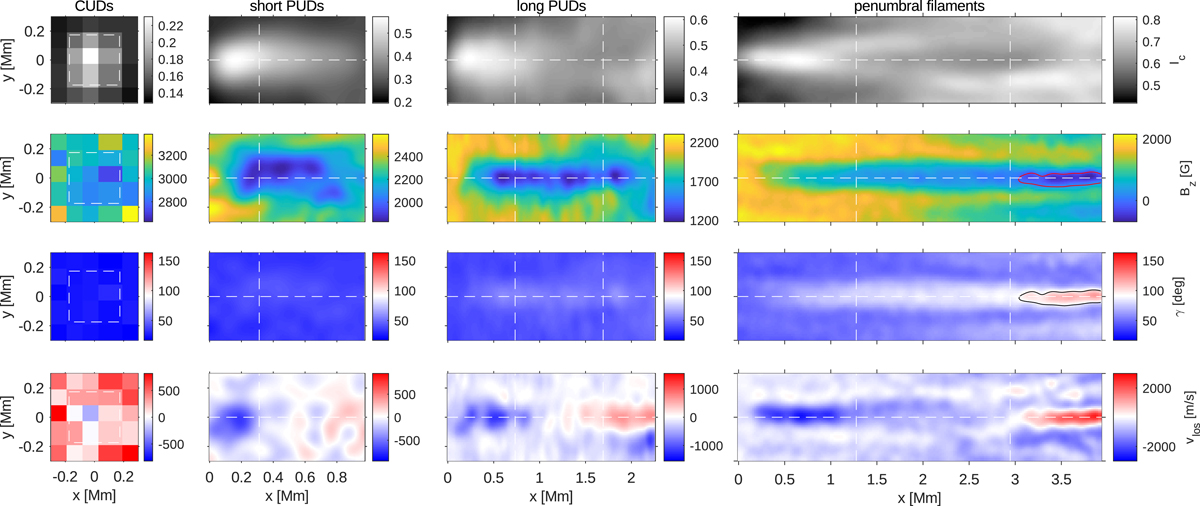
Fig. 3.
Download original image
Ensemble averages of various observables for the different types of features in AR 10923 (see Fig. 1). From left to right: CUDs, short PUDs, long PUDs, and penumbral filaments in the inner penumbra. From top to bottom: continuum intensity, vertical magnetic field, inclination of the magnetic field, and line-of-sight velocity. The white vertical lines separate the heads, bodies, and tails of the PUDs and of the penumbral filaments. In the case of the short PUDs, we only separate between the head and the body since we do not observe tails for these features when considering them individually. The dashed squares in the left column outline the umbral dot, and the horizontal lines in the other columns indicate the central axis of the features. The red contours in the maps of Bz and the black contours in the maps of γ indicate regions where the polarity of the field changes. The range of the y axis is ±0.3 Mm in all panels except for the ones showing the results for the penumbral filaments. Here, the range of the y axis is ±0.5 Mm. We note that the aspect ratios of the plots in Cols. 2, 3, and 4 are not correct.
Current usage metrics show cumulative count of Article Views (full-text article views including HTML views, PDF and ePub downloads, according to the available data) and Abstracts Views on Vision4Press platform.
Data correspond to usage on the plateform after 2015. The current usage metrics is available 48-96 hours after online publication and is updated daily on week days.
Initial download of the metrics may take a while.