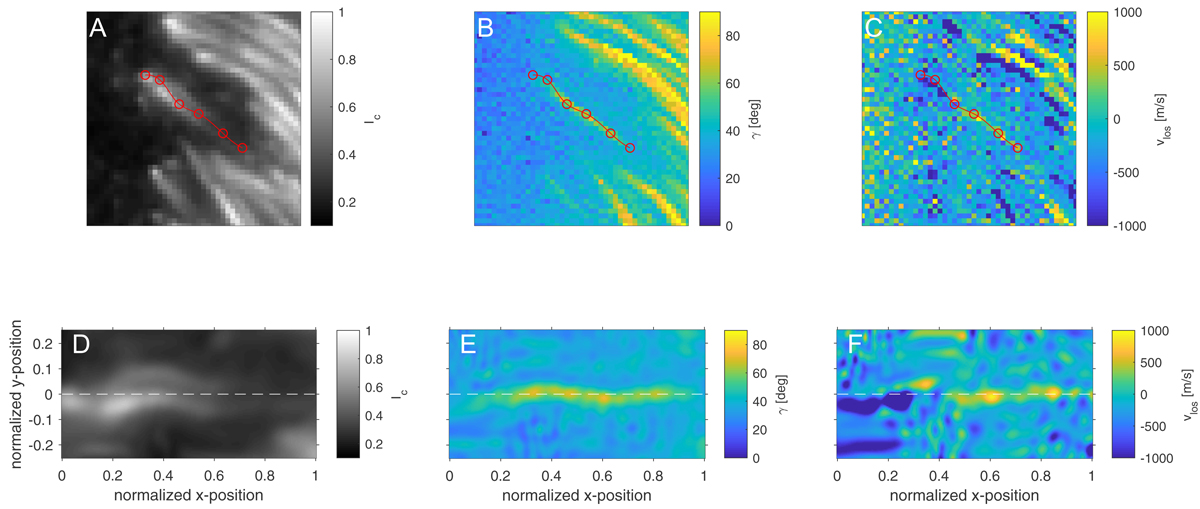
Fig. 2.
Download original image
Selection of individual PUDs. We identified individual PUDs using maps of the continuum intensity (panel A), maps of the inclination of the magnetic field vector with respect to the local vertical axis (panel B), and maps of the line-of-sight velocity (panel C). The last two observables are derived from the inversion at τ = 1. We manually selected pixels along the main axis of the PUD (indicated by the red circles in panels A to C). These individual points are then connected using a spline interpolation (solid red curves in panels A to C). This curve is then used to retrieve the de-stretched, de-rotated, and length-normalized PUDs (shown in panels D to F). See Sect. 2.2 for more details on the identification of individual features. This procedure is analogous to the identification of individual penumbral filaments in Tiwari et al. (2013).
Current usage metrics show cumulative count of Article Views (full-text article views including HTML views, PDF and ePub downloads, according to the available data) and Abstracts Views on Vision4Press platform.
Data correspond to usage on the plateform after 2015. The current usage metrics is available 48-96 hours after online publication and is updated daily on week days.
Initial download of the metrics may take a while.