Fig. 1.
Download original image
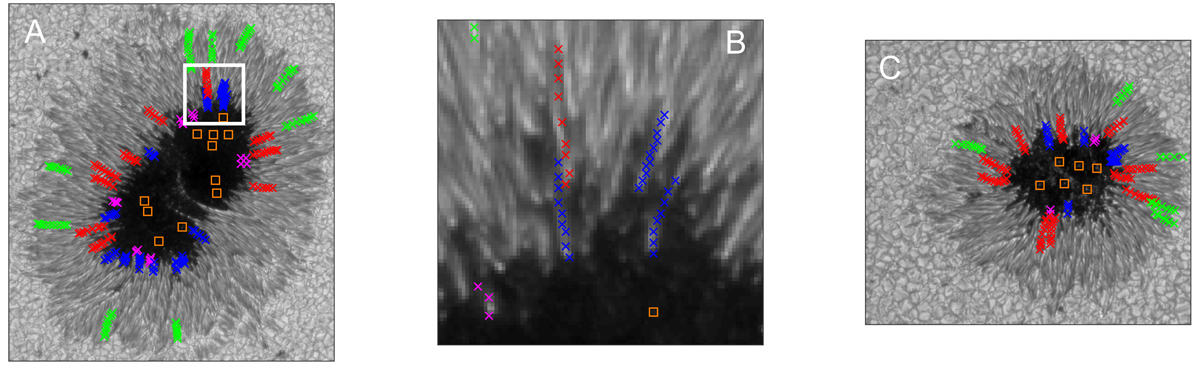
Maps of the continuum intensity obtained by Hinode/SOT of the two sunspots used in this study. Panel A: large sunspot AR 10923 observed on 14 November 2006. Panel B: zoomed-in view of a region around the UP boundary of AR 10923 (as indicated by the white rectangle in panel A). Panel C: small sunspot AR 10933 observed on 6 January 2007. The colored symbols indicate the individual features used in this study: CUDs (orange), short PUDs (purple), long PUDs (blue), penumbral filaments in the inner penumbra (red), and penumbral filaments in the outer penumbra (green). See text for more details on how we selected the individual features.
Current usage metrics show cumulative count of Article Views (full-text article views including HTML views, PDF and ePub downloads, according to the available data) and Abstracts Views on Vision4Press platform.
Data correspond to usage on the plateform after 2015. The current usage metrics is available 48-96 hours after online publication and is updated daily on week days.
Initial download of the metrics may take a while.