Fig. 3.
Download original image
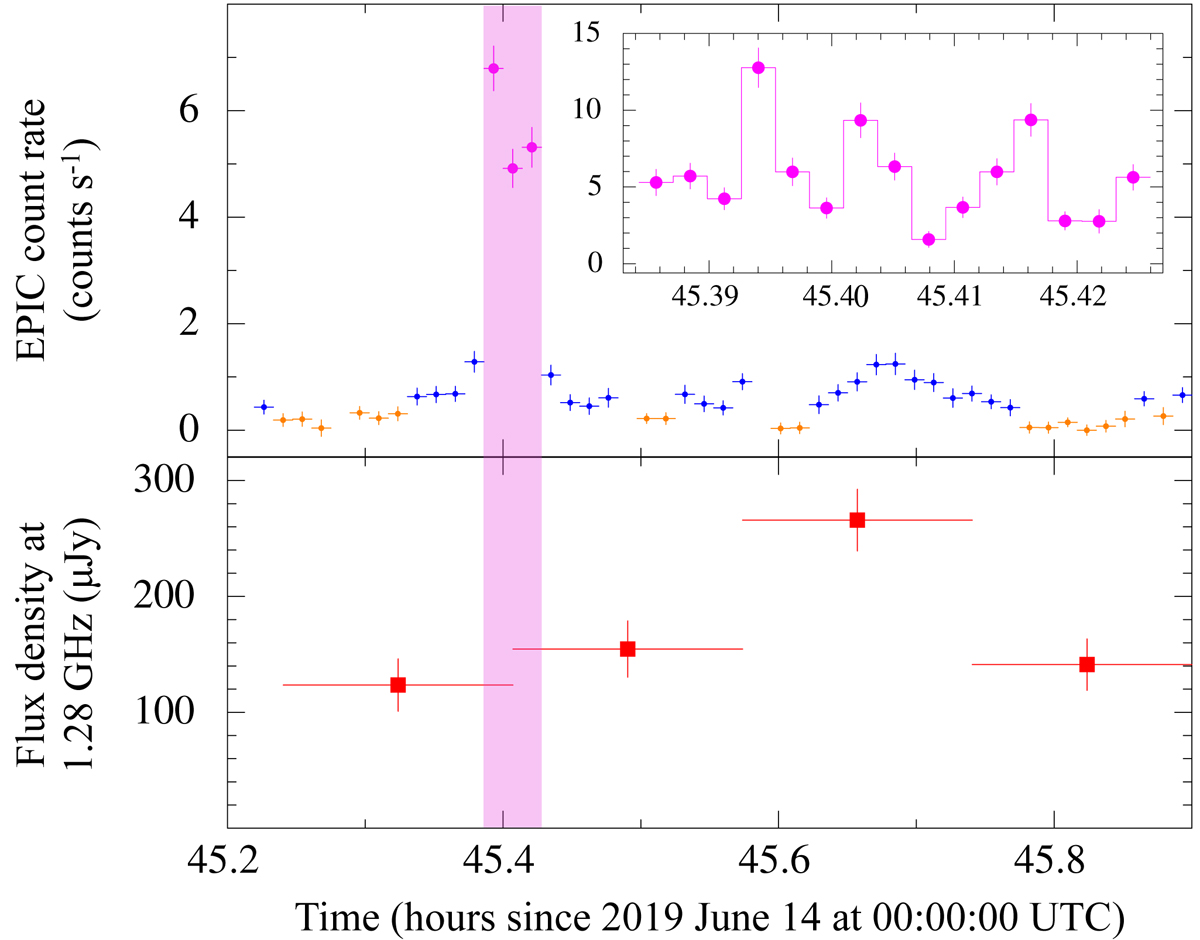
Zoom of the light curves around the epoch of the brightest X-ray flare (top; time bin of 50 s) and the radio flare (bottom; time bin of 10 min). The X-ray modes are color-coded as in Fig. 2. The shaded area in magenta marks the epoch of the X-ray flare. The inset in the top panel shows a further zoom of the X-ray light curve at the epoch of the X-ray flare and is binned at 10 s. In all panels, error bars represent 1σ uncertainties.
Current usage metrics show cumulative count of Article Views (full-text article views including HTML views, PDF and ePub downloads, according to the available data) and Abstracts Views on Vision4Press platform.
Data correspond to usage on the plateform after 2015. The current usage metrics is available 48-96 hours after online publication and is updated daily on week days.
Initial download of the metrics may take a while.