Fig. 2.
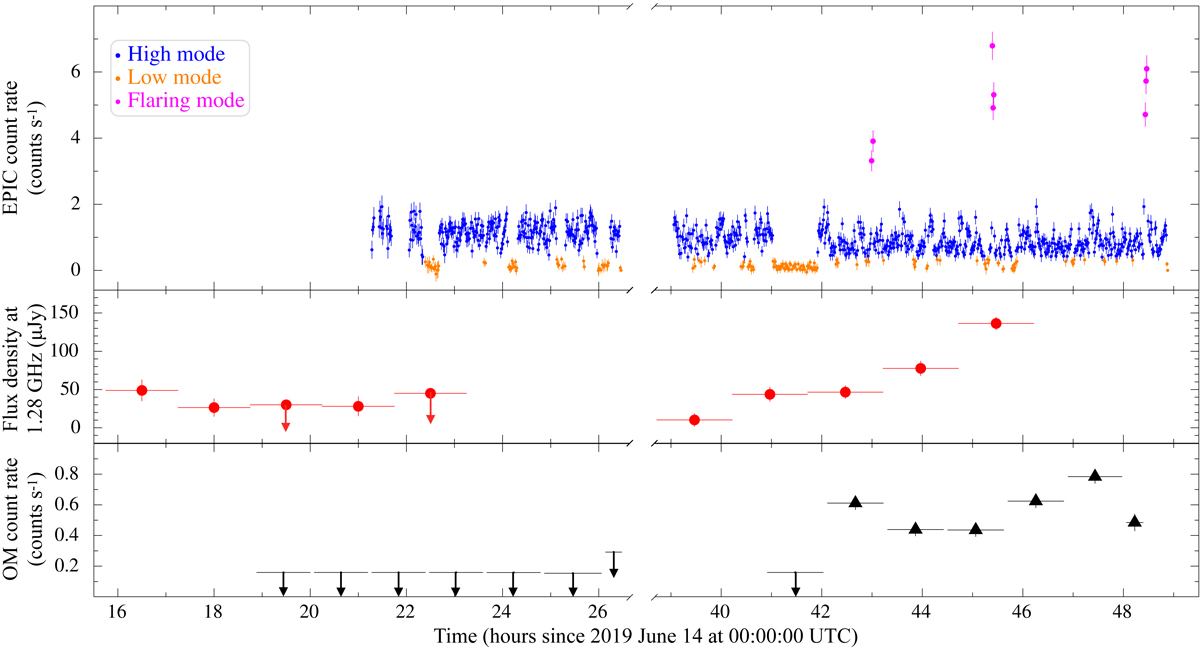
Download original image
Multi-band light curves of J1109 on 2019 June 14–16. The X-ray light curve (top) is in the 0.3−10 keV energy band and is binned at 50 s. The flaring, high and low modes intervals are depicted in magenta, blue and orange, respectively (see the text for their definition). The radio light curve (middle) is in the L band (central frequency of 1.284 GHz) and is binned at 1.5 h. The optical light curve (bottom) is in white light and was extracted using the net count rates measured in the single images (of lengths of 4 or 1.2 ks). Upper limits are reported for the images where the source was undetected. In all panels, error bars represent 1σ uncertainties, while upper limits are given at a confidence level of 3σ.
Current usage metrics show cumulative count of Article Views (full-text article views including HTML views, PDF and ePub downloads, according to the available data) and Abstracts Views on Vision4Press platform.
Data correspond to usage on the plateform after 2015. The current usage metrics is available 48-96 hours after online publication and is updated daily on week days.
Initial download of the metrics may take a while.