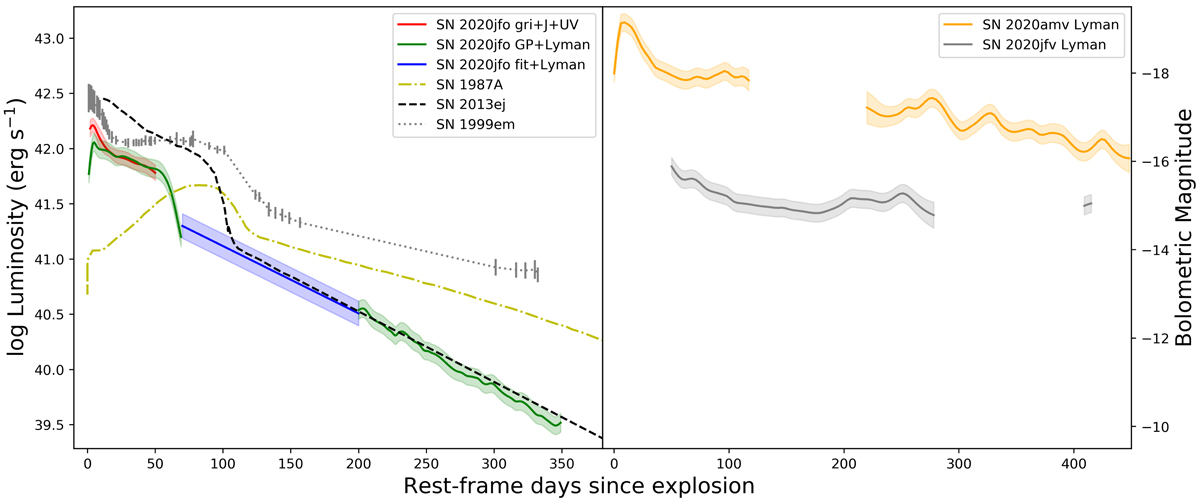
Fig. 7.
Download original image
Bolometric luminosities for our SNe. Left: SN 2020jfo with some comparison objects (see text). The green solid lines with shaded regions are estimated with the Lyman et al. (2016) method and is a Gaussian Process fit to that LC. The blue region is a linear interpolation for the region with less data. The red fit on the plateau is for a diluted BB fit to our UV through NIR data, and matches the Lyman et al. method well on the later part of the plateau. Right: SNe 2020amv and 2020jfv. These were derived using the Lyman et al. method, which is rather approximate given the unusual nature of these SNe.
Current usage metrics show cumulative count of Article Views (full-text article views including HTML views, PDF and ePub downloads, according to the available data) and Abstracts Views on Vision4Press platform.
Data correspond to usage on the plateform after 2015. The current usage metrics is available 48-96 hours after online publication and is updated daily on week days.
Initial download of the metrics may take a while.