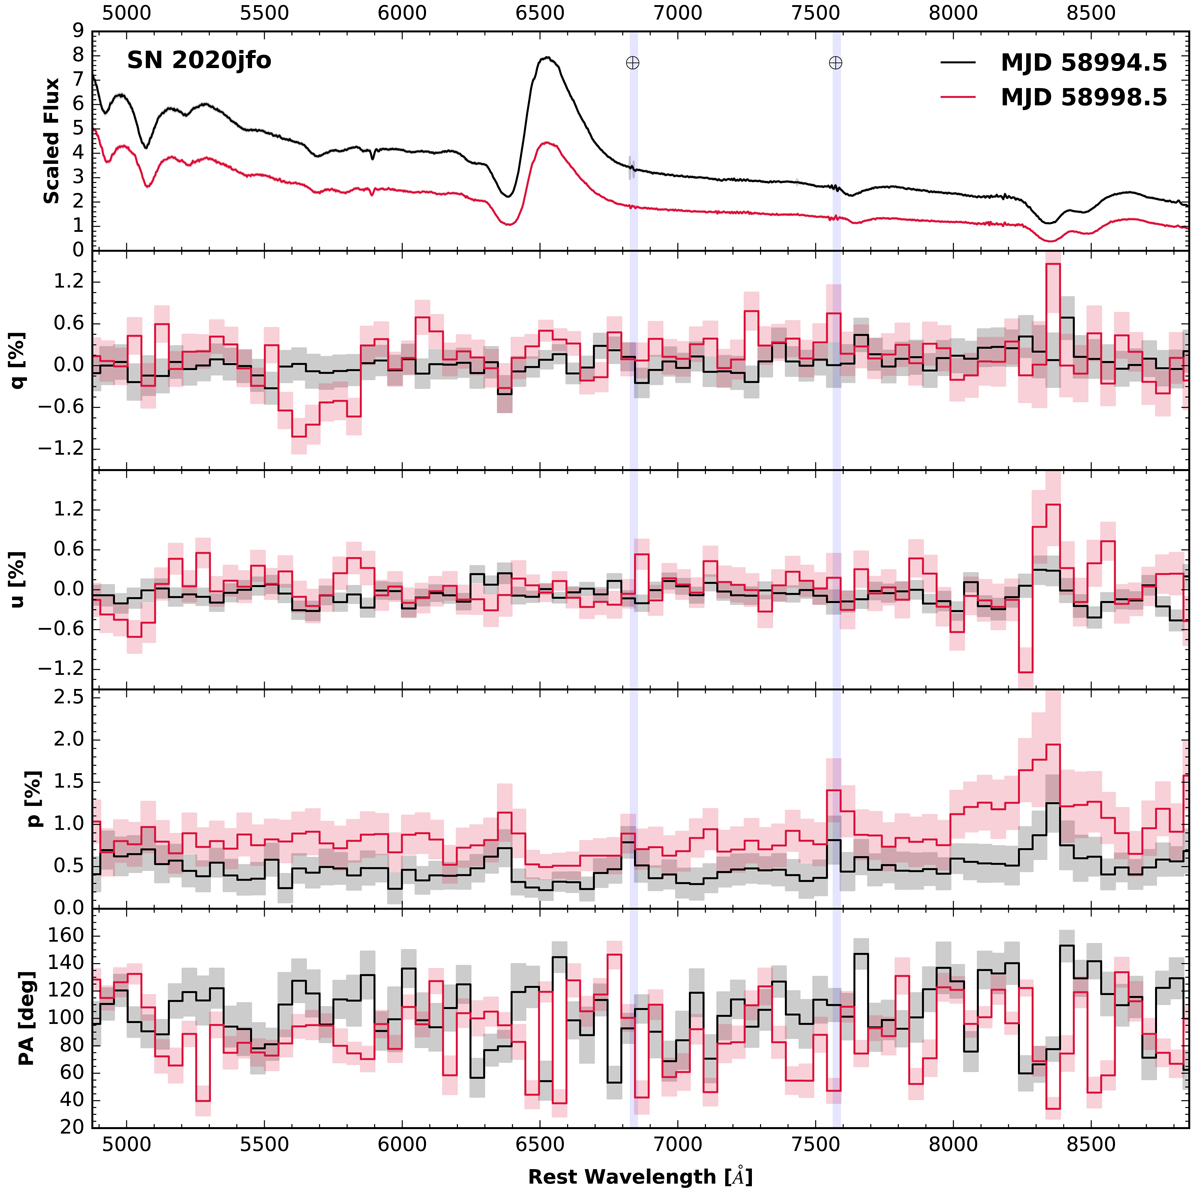
Fig. 5.
Download original image
Spectropolarimetry of SN 2020jfo on 2020 May 25 and May 29. The panels (from top to bottom) show total flux, Stokes Q, Stokes U, debiased polarization, and the position angle. The vertical bands represent the regions of potential telluric overcorrection. The data, except for total flux, are binned to 50 Å to improve the S/N.
Current usage metrics show cumulative count of Article Views (full-text article views including HTML views, PDF and ePub downloads, according to the available data) and Abstracts Views on Vision4Press platform.
Data correspond to usage on the plateform after 2015. The current usage metrics is available 48-96 hours after online publication and is updated daily on week days.
Initial download of the metrics may take a while.