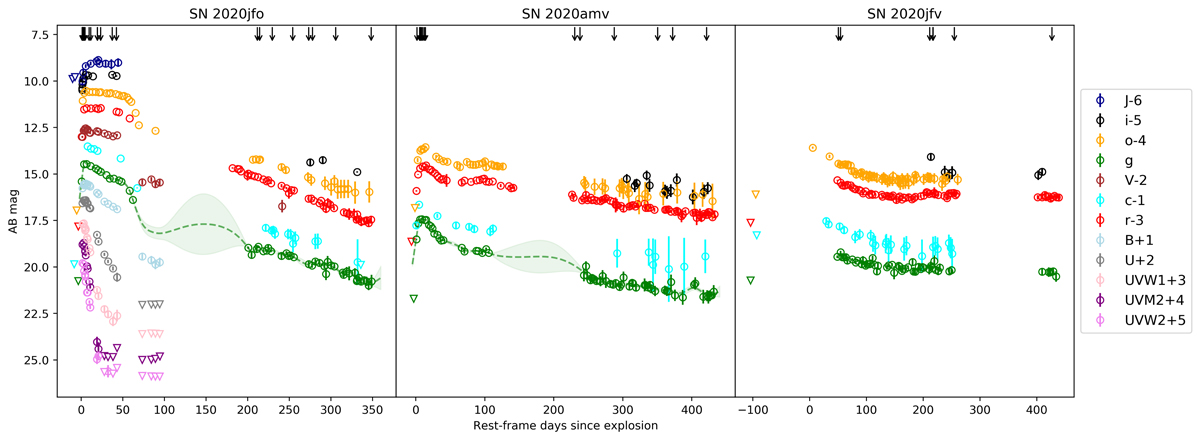
Fig. 2.

Download original image
Light curves of the three supernovae. Left: SN 2020jfo in multiple bands with symbols and offsets as provided in the legend to the very right. In this case it includes six passbands from Swift and three from ZTF and LT, as well as near-infrared J-band data. These are observed (AB) magnitudes plotted versus rest-frame time in days since explosion. For the J-band data, the Vega/AB magnitude conversion follows Blanton & Roweis (2007). ATLAS forced photometry in the c and o bands is also included, and the ZTF and ATLAS data are in 3 day bins. The arrows on top indicate the epochs of spectroscopy, and the lines with error regions are Gaussian Process estimates of the interpolated LCs (for g band). Middle and right panels: LCs for SN 2020amv and SN 2020jfv, respectively.
Current usage metrics show cumulative count of Article Views (full-text article views including HTML views, PDF and ePub downloads, according to the available data) and Abstracts Views on Vision4Press platform.
Data correspond to usage on the plateform after 2015. The current usage metrics is available 48-96 hours after online publication and is updated daily on week days.
Initial download of the metrics may take a while.


