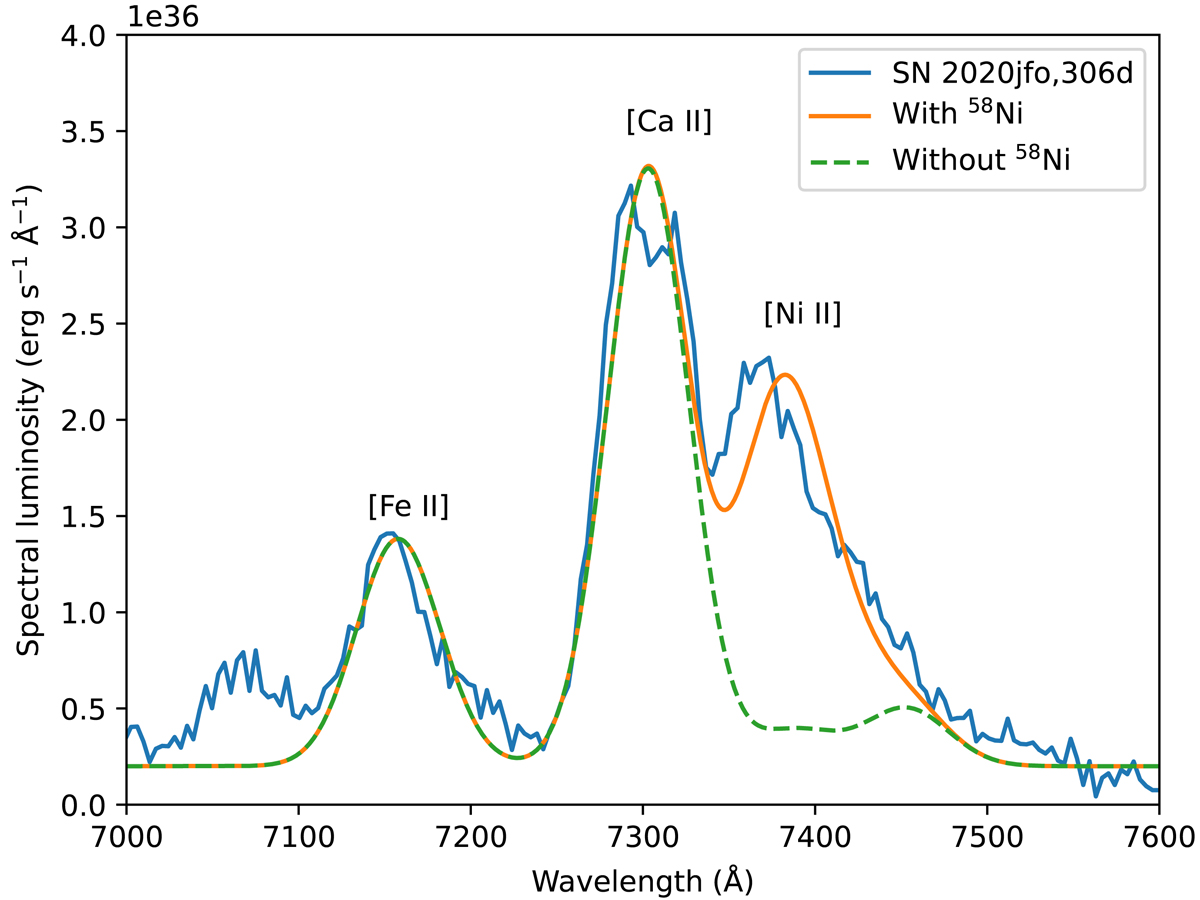
Fig. 10.
Download original image
Spectrum (7000−7600 Å) for SN 2020jfo at +306 days (blue lines). It has been demonstrated that this region is dominated by emission from [Fe II], [Ni II], and [Ca II] (Jerkstrand et al. 2015b). Shown in orange is the best-fit multiple-Gaussian model to the emission lines following the method of Jerkstrand et al. (2015b). This fit gives LNi II 7378/LFe II 7155 = 1.7, which maps to a mass ratio M(Ni)/M(Fe)≈2 times solar. The green dashed line shows the fit without contributions from stable nickel.
Current usage metrics show cumulative count of Article Views (full-text article views including HTML views, PDF and ePub downloads, according to the available data) and Abstracts Views on Vision4Press platform.
Data correspond to usage on the plateform after 2015. The current usage metrics is available 48-96 hours after online publication and is updated daily on week days.
Initial download of the metrics may take a while.