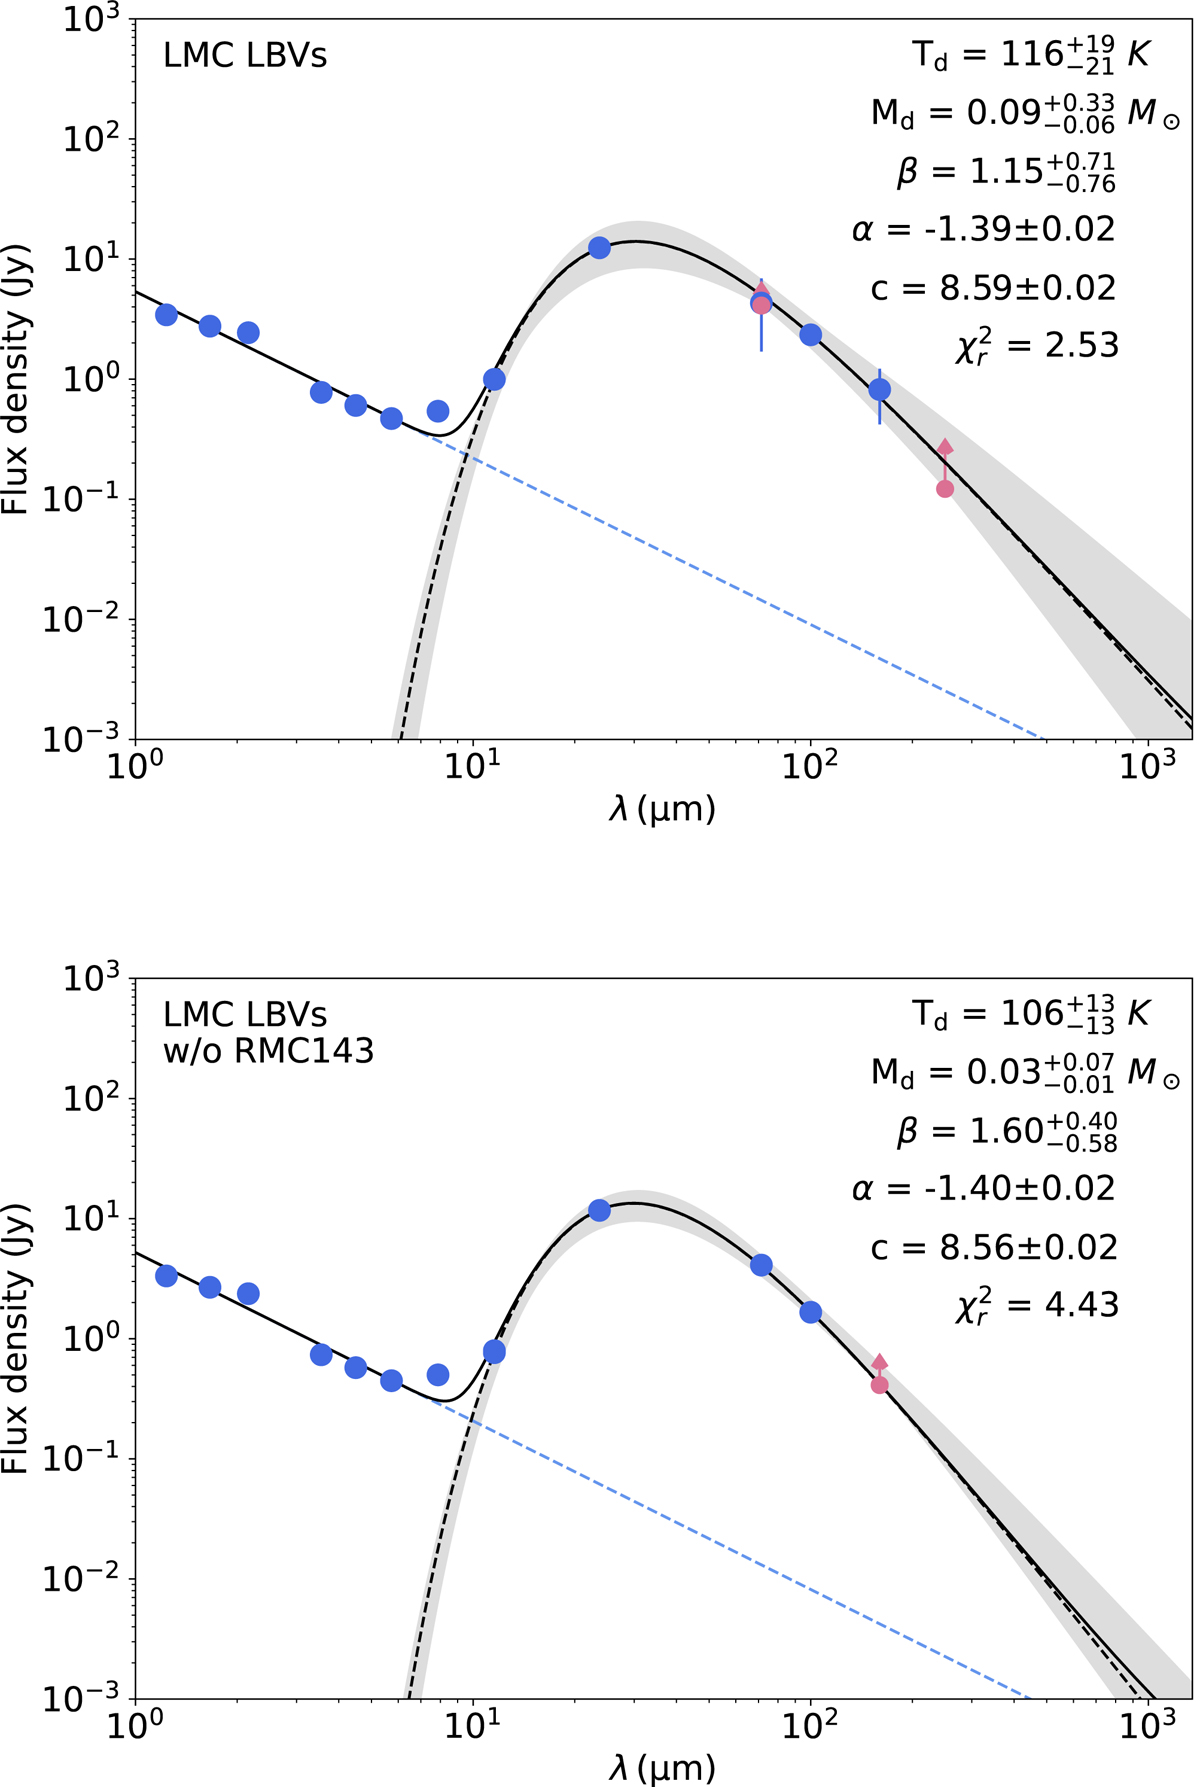
Fig. 8.
Download original image
Flux density distribution of stacks of the LBVs in the LMC (SED Classes 1 and 2 in Table 1), with (top) and without (bottom) RMC 143. 2MASS and IRAC values are the sum of the individual source fluxes, while WISE-W3, MIPS and PACS values are from photometry performed on the stacked images (Fig. 7). Parameters from the fitting procedure are shown (α and c are the spectral index and offset of the best-fit power-law describing the near-infrared data; Td, Md and β are the dust temperature, mass and opacity power law index of the best-fit greybody describing the thermal emission from dust). The lower limits (red points and arrow symbols) for MIPS70 and SPIRE250 in the upper plot and PACS160 in the lower plot are from stacks of subsets of sources (see text for the subsets in each case), as there is not a reliable detection in the stacked images of the whole sample.
Current usage metrics show cumulative count of Article Views (full-text article views including HTML views, PDF and ePub downloads, according to the available data) and Abstracts Views on Vision4Press platform.
Data correspond to usage on the plateform after 2015. The current usage metrics is available 48-96 hours after online publication and is updated daily on week days.
Initial download of the metrics may take a while.