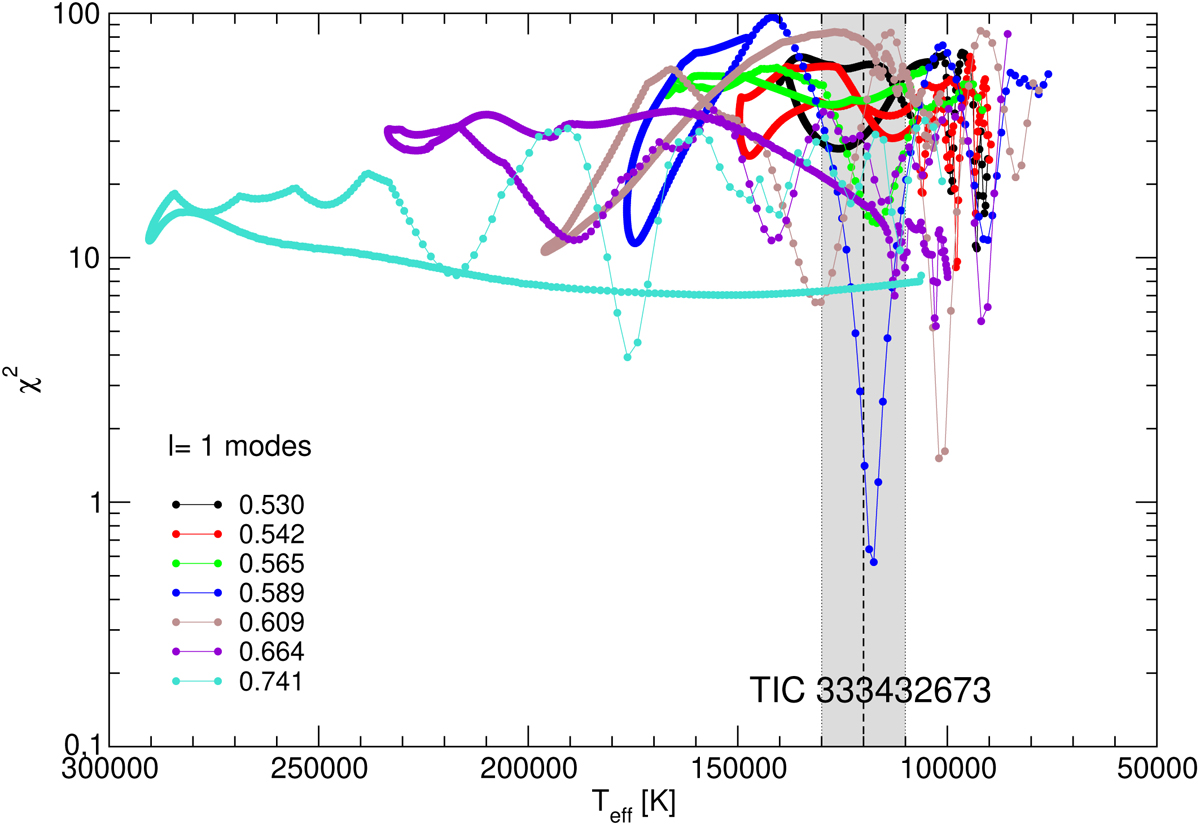
Fig. 8.
Download original image
The quality function of the period fits in terms of the effective temperature for the PG 1159 sequences with different stellar masses (in solar units) corresponding to the case in which all the observed periods are assumed to be associated to dipole (ℓ = 1) modes. We note the presence of a strong minimum corresponding to M⋆ = 0.589 M⊙ and Teff = 117 560 K. The vertical dashed line is the spectroscopic Teff of TIC 333432673 (120 000 K) and the gray zone depicts its uncertainties (±10 000 K).
Current usage metrics show cumulative count of Article Views (full-text article views including HTML views, PDF and ePub downloads, according to the available data) and Abstracts Views on Vision4Press platform.
Data correspond to usage on the plateform after 2015. The current usage metrics is available 48-96 hours after online publication and is updated daily on week days.
Initial download of the metrics may take a while.