Fig. 4.
Download original image
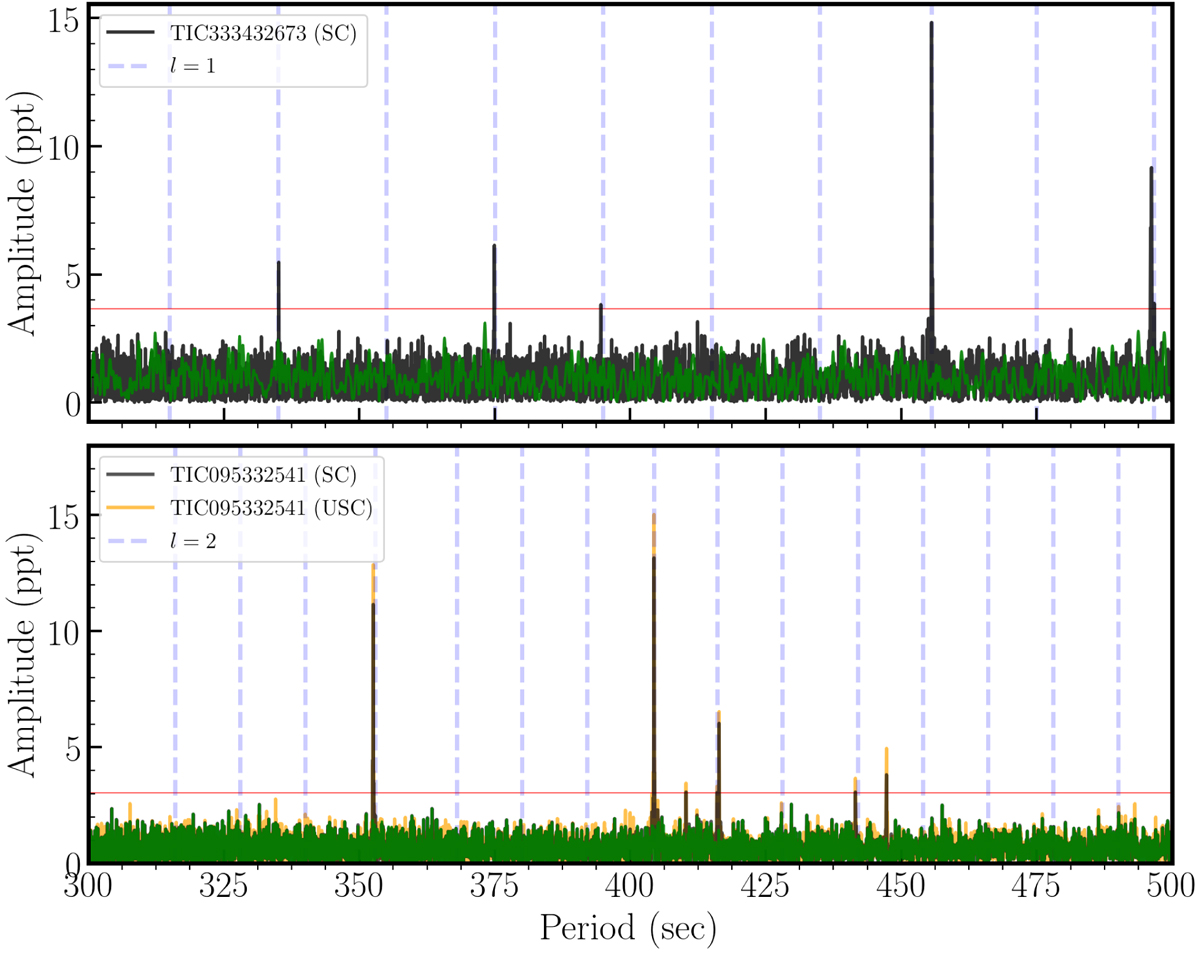
Pulsation spectrum in period of the new pulsating DOV stars TIC 333432673 (upper panel) and TIC 095332541 (lower panel). For TIC 095332541, we overplotted the Fourier Transform of both 120 s data (black) and 20 s (orange). The horizontal red line indicates the 0.1% false-alarm probability (FAP) level. In green we depict the FT of the prewhitened light curve. The blue vertical dashed lines indicate the expected locations of ℓ = 1 modes for TIC 333432673 and ℓ = 2 modes for TIC 095332541 from the asymptotic pulsation theory described in Sect. 5.2.
Current usage metrics show cumulative count of Article Views (full-text article views including HTML views, PDF and ePub downloads, according to the available data) and Abstracts Views on Vision4Press platform.
Data correspond to usage on the plateform after 2015. The current usage metrics is available 48-96 hours after online publication and is updated daily on week days.
Initial download of the metrics may take a while.