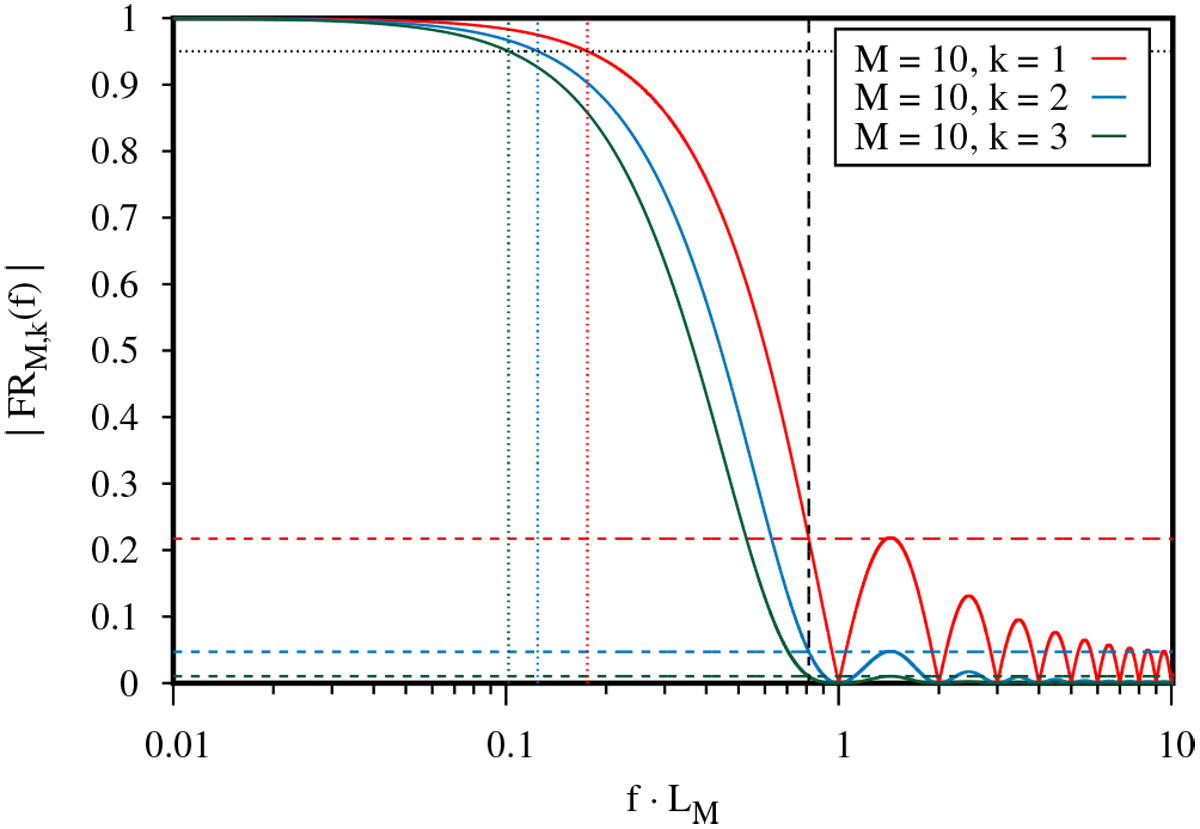
Fig. B.2

Download original image
Absolute value of the frequency response for the Kolmogorov-Zurbenko filter (the moving average corresponds to the case k = 1). The vertical dashed black line stands for the cutoff frequency fc given by Eq. (B.14), while the horizontal coloured lines represent the maximum gains in the stopband αk = ηk. The vertical dotted coloured lines show the passband frequencies fp given by Eq. (B.17) for a loss level of 5%, which is represented by the horizontal dotted black line.
Current usage metrics show cumulative count of Article Views (full-text article views including HTML views, PDF and ePub downloads, according to the available data) and Abstracts Views on Vision4Press platform.
Data correspond to usage on the plateform after 2015. The current usage metrics is available 48-96 hours after online publication and is updated daily on week days.
Initial download of the metrics may take a while.


