Fig. 6
Download original image
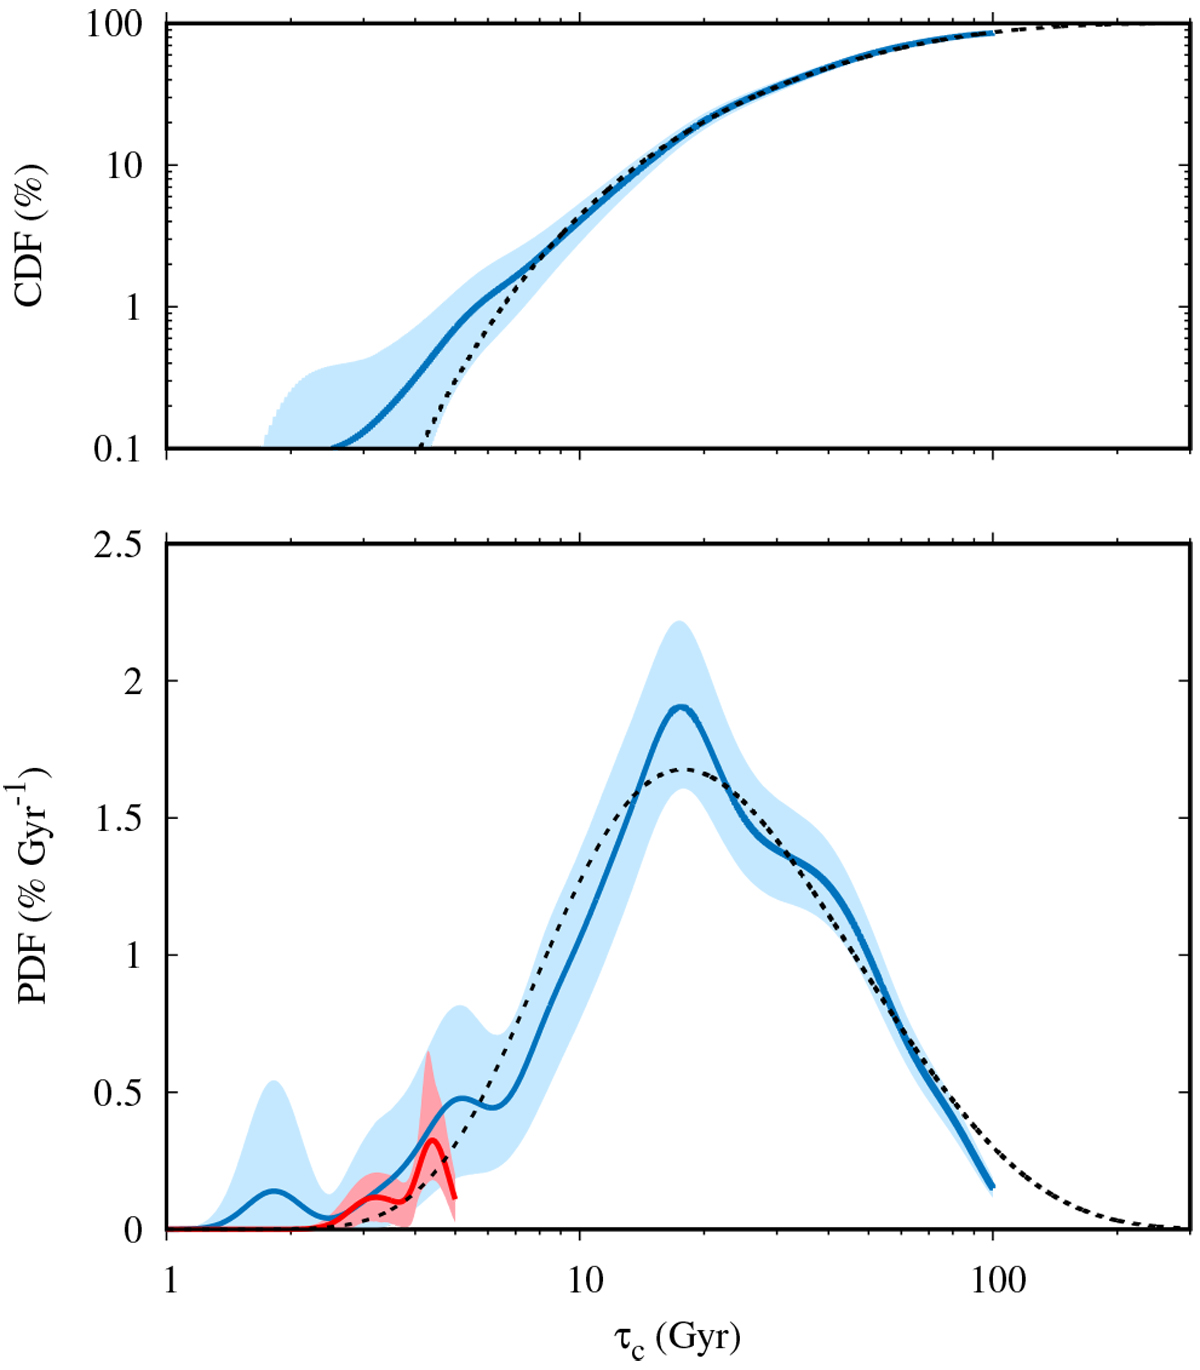
Kernel density estimation of the PDF of the time τc of the first secular collision from 1042 integrations of the forced inner system over 100 Gyr (blue line in the lower panel). The estimate of the CDF is shown as a blue line in the upper panel. The blue regions represent the pointwise confidence intervals at the 98% level from bootstrap. In red we show the PDF estimate over 5 Gyr from the 10 560 orbital solutions of Sect. 7. The dashed black lines stand for the analytical PDF (57) with T1 = 27.6 Gyr and α = 0.9 and the corresponding CDF.
Current usage metrics show cumulative count of Article Views (full-text article views including HTML views, PDF and ePub downloads, according to the available data) and Abstracts Views on Vision4Press platform.
Data correspond to usage on the plateform after 2015. The current usage metrics is available 48-96 hours after online publication and is updated daily on week days.
Initial download of the metrics may take a while.