Fig. 7.
Download original image
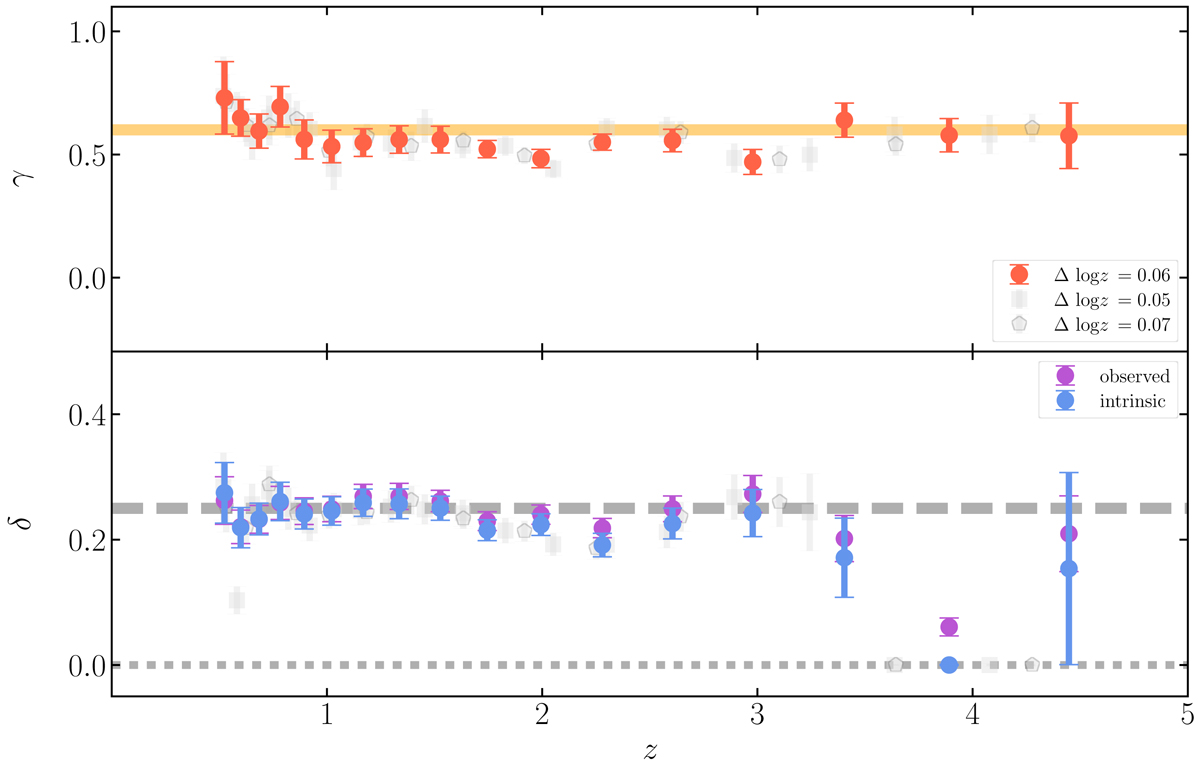
Regression analysis of the final selected sample (Γ = 1.7−2.8, k δobs = 0.6). The division of the sample in logarithmic redshift bins of size Δlog(z)=0.06 yields 17 bins with more than five objects. The results for two fitting methods adopted, emcee and linmix, are plotted in (dashed) lime green and magenta, respectively. For each sub-plot, the inset shows the distribution of off-axis angles Θ for the sources in the redshift bin. Sources with at least one observation with SN < 5 in the soft band are marked with a red point. For each redshift bin, we list the median redshift ⟨z⟩, the number of data points N and dispersion and slope from the emcee algorithm.
Current usage metrics show cumulative count of Article Views (full-text article views including HTML views, PDF and ePub downloads, according to the available data) and Abstracts Views on Vision4Press platform.
Data correspond to usage on the plateform after 2015. The current usage metrics is available 48-96 hours after online publication and is updated daily on week days.
Initial download of the metrics may take a while.