Fig. 6.
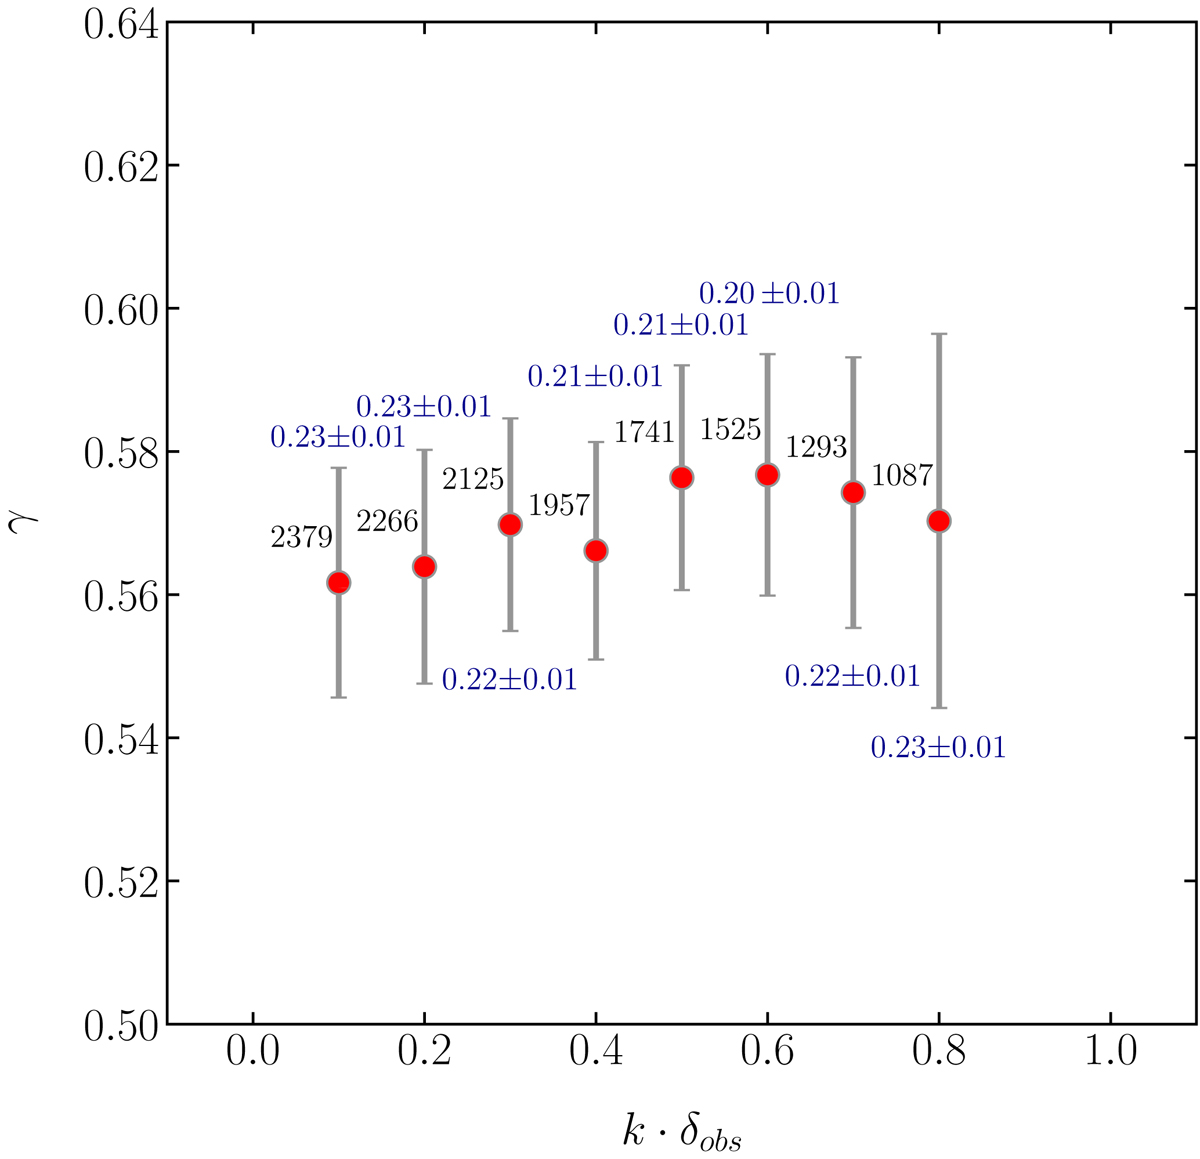
Download original image
Mean slope for the fX − fUV relation for the case of Γ = 1.7−2.8, evaluated as the arithmetic mean of all the slopes in the redshift bins with more than five objects, as a function of k δobs, that is of the amount of sources excluded from the sample because of the selection for the Eddington bias (see text for details). The mean slope is flatter for low values of k, reaches a maximum of γ ∼ 0.58 and then drops back while k increases. Mean dispersion as a function of k δobs is listed in blue, while in black the number of sources surviving the selection for each k δobs choice.
Current usage metrics show cumulative count of Article Views (full-text article views including HTML views, PDF and ePub downloads, according to the available data) and Abstracts Views on Vision4Press platform.
Data correspond to usage on the plateform after 2015. The current usage metrics is available 48-96 hours after online publication and is updated daily on week days.
Initial download of the metrics may take a while.