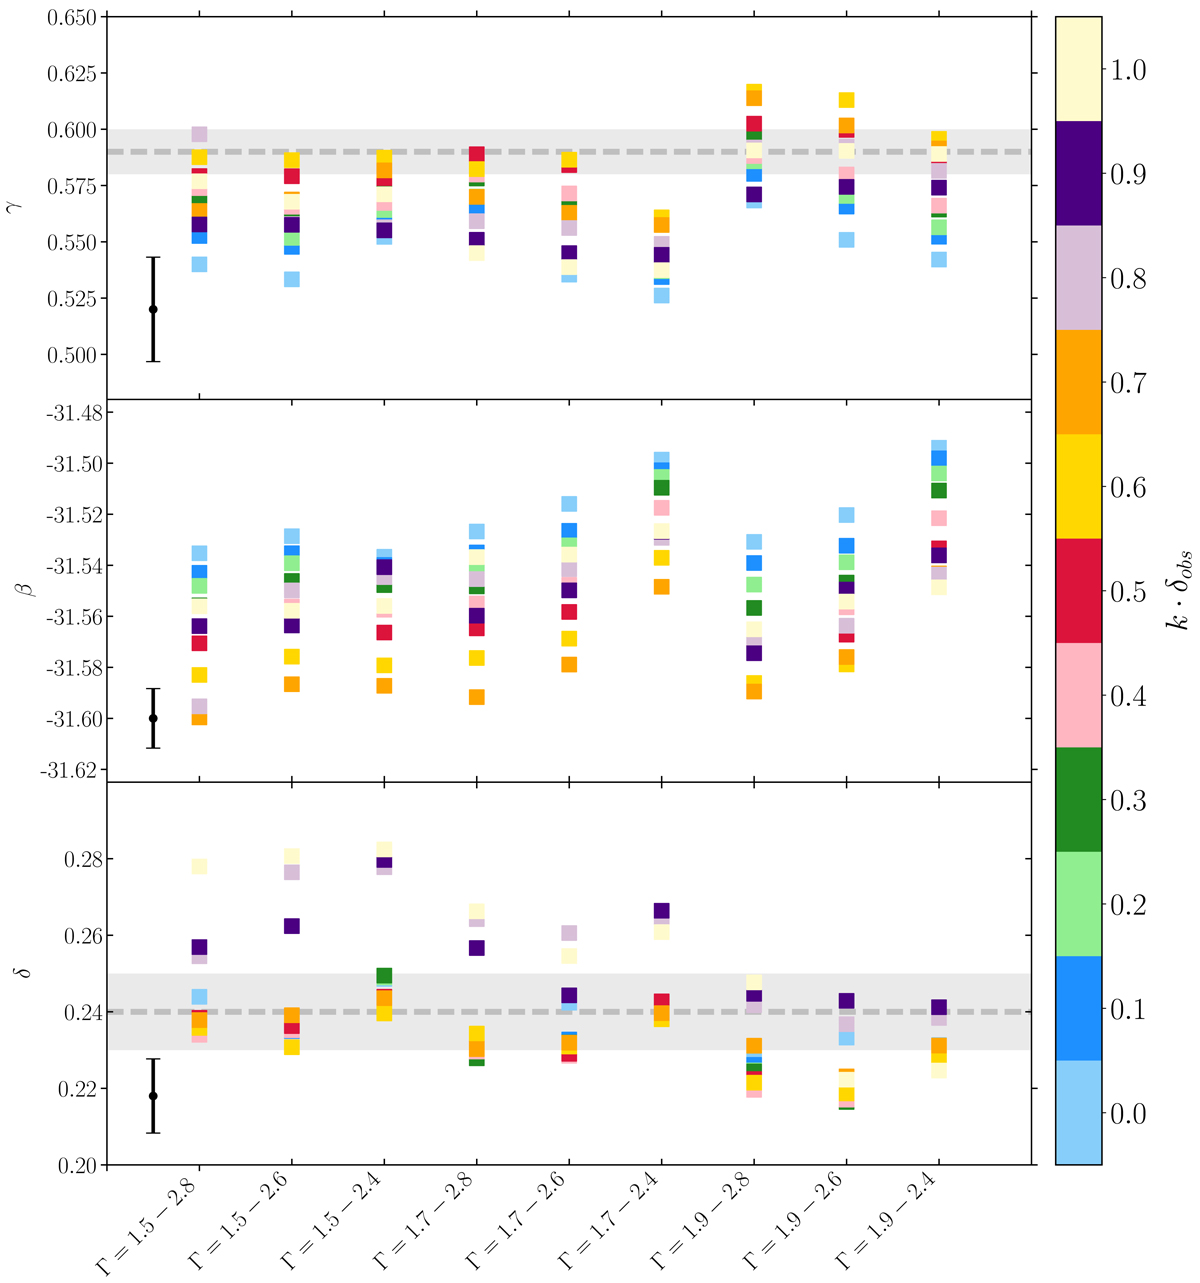
Fig. C.1.
Download original image
Results of the analysis on the fX − fUV relation. Different choices for the photon index Γ are on the x axis, while those for k δobs are shown as different colours. The squares represent the mean slope (top panel), intercept (mid panel) and dispersion (bottom panel) for all the redshift bins (Δlog(z)=0.06) with more than five objects after the chosen cuts in Γ and k δobs are applied. In black, we show the typical error on the estimates for the three quantities.
Current usage metrics show cumulative count of Article Views (full-text article views including HTML views, PDF and ePub downloads, according to the available data) and Abstracts Views on Vision4Press platform.
Data correspond to usage on the plateform after 2015. The current usage metrics is available 48-96 hours after online publication and is updated daily on week days.
Initial download of the metrics may take a while.