Free Access
Fig. A.2.
Download original image
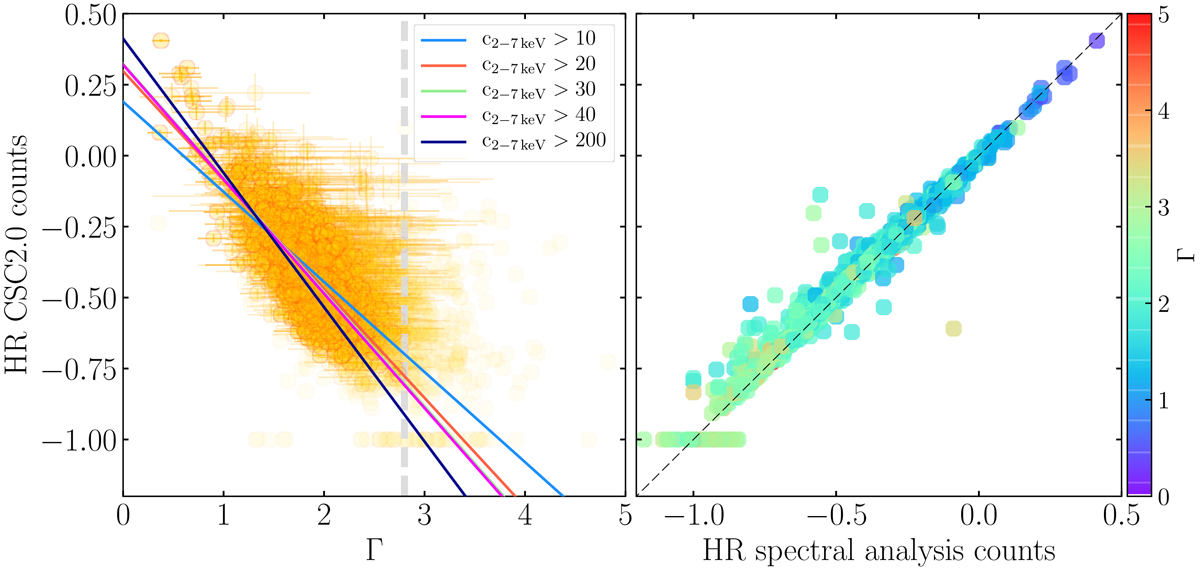
Left. Distribution of the HR computed from the catalogued counts as a function of the photon index output of our spectral analysis. Right. Comparison between the HR computed from the catalogued counts and the one resulting from our spectral analysis. Points are coloured as a function of the source photon index (right bar).
Current usage metrics show cumulative count of Article Views (full-text article views including HTML views, PDF and ePub downloads, according to the available data) and Abstracts Views on Vision4Press platform.
Data correspond to usage on the plateform after 2015. The current usage metrics is available 48-96 hours after online publication and is updated daily on week days.
Initial download of the metrics may take a while.