Fig. A.1.
Download original image
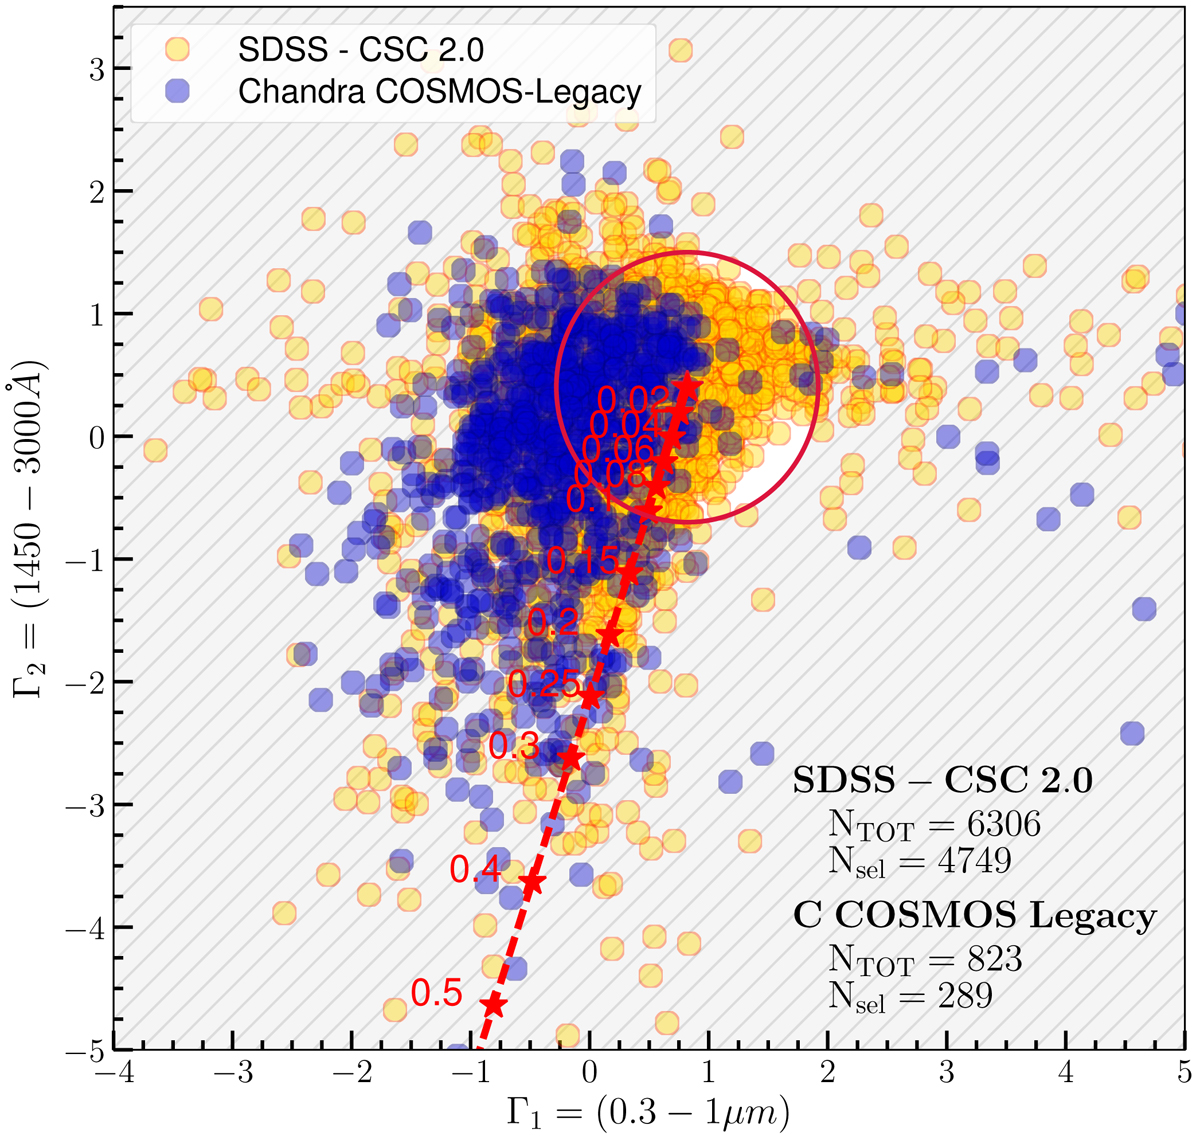
Distribution of the quasar sample (excluding radio-loud and BAL sources) in a Γ1–Γ2 plane, where Γ1 and Γ2 are the slopes of a power law in the log ν–(log νLν) plane, at 0.3–1 μm and 1450–3000 Å, respectively. The red stars represent Γ1–Γ2 values for the intrinsic mean SED for quasars of Richards et al. (2006) reddened by the presence of dust (extinction law of Prevot et al. 1984) with increasing E(B-V), ranging from 0 to 0.5. We selected the sources inside the red circle of centre E(B − V)=0 and radius ∼1 (corresponding to E(B − V)=0.1), characterised by the minimum extinction. Other possible explanations to the deviation of points from the locus of blue quasars are, for example, the presence of host-galaxy contamination and, trivially, wrong photometric measurements.
Current usage metrics show cumulative count of Article Views (full-text article views including HTML views, PDF and ePub downloads, according to the available data) and Abstracts Views on Vision4Press platform.
Data correspond to usage on the plateform after 2015. The current usage metrics is available 48-96 hours after online publication and is updated daily on week days.
Initial download of the metrics may take a while.