Fig. 11.
Download original image
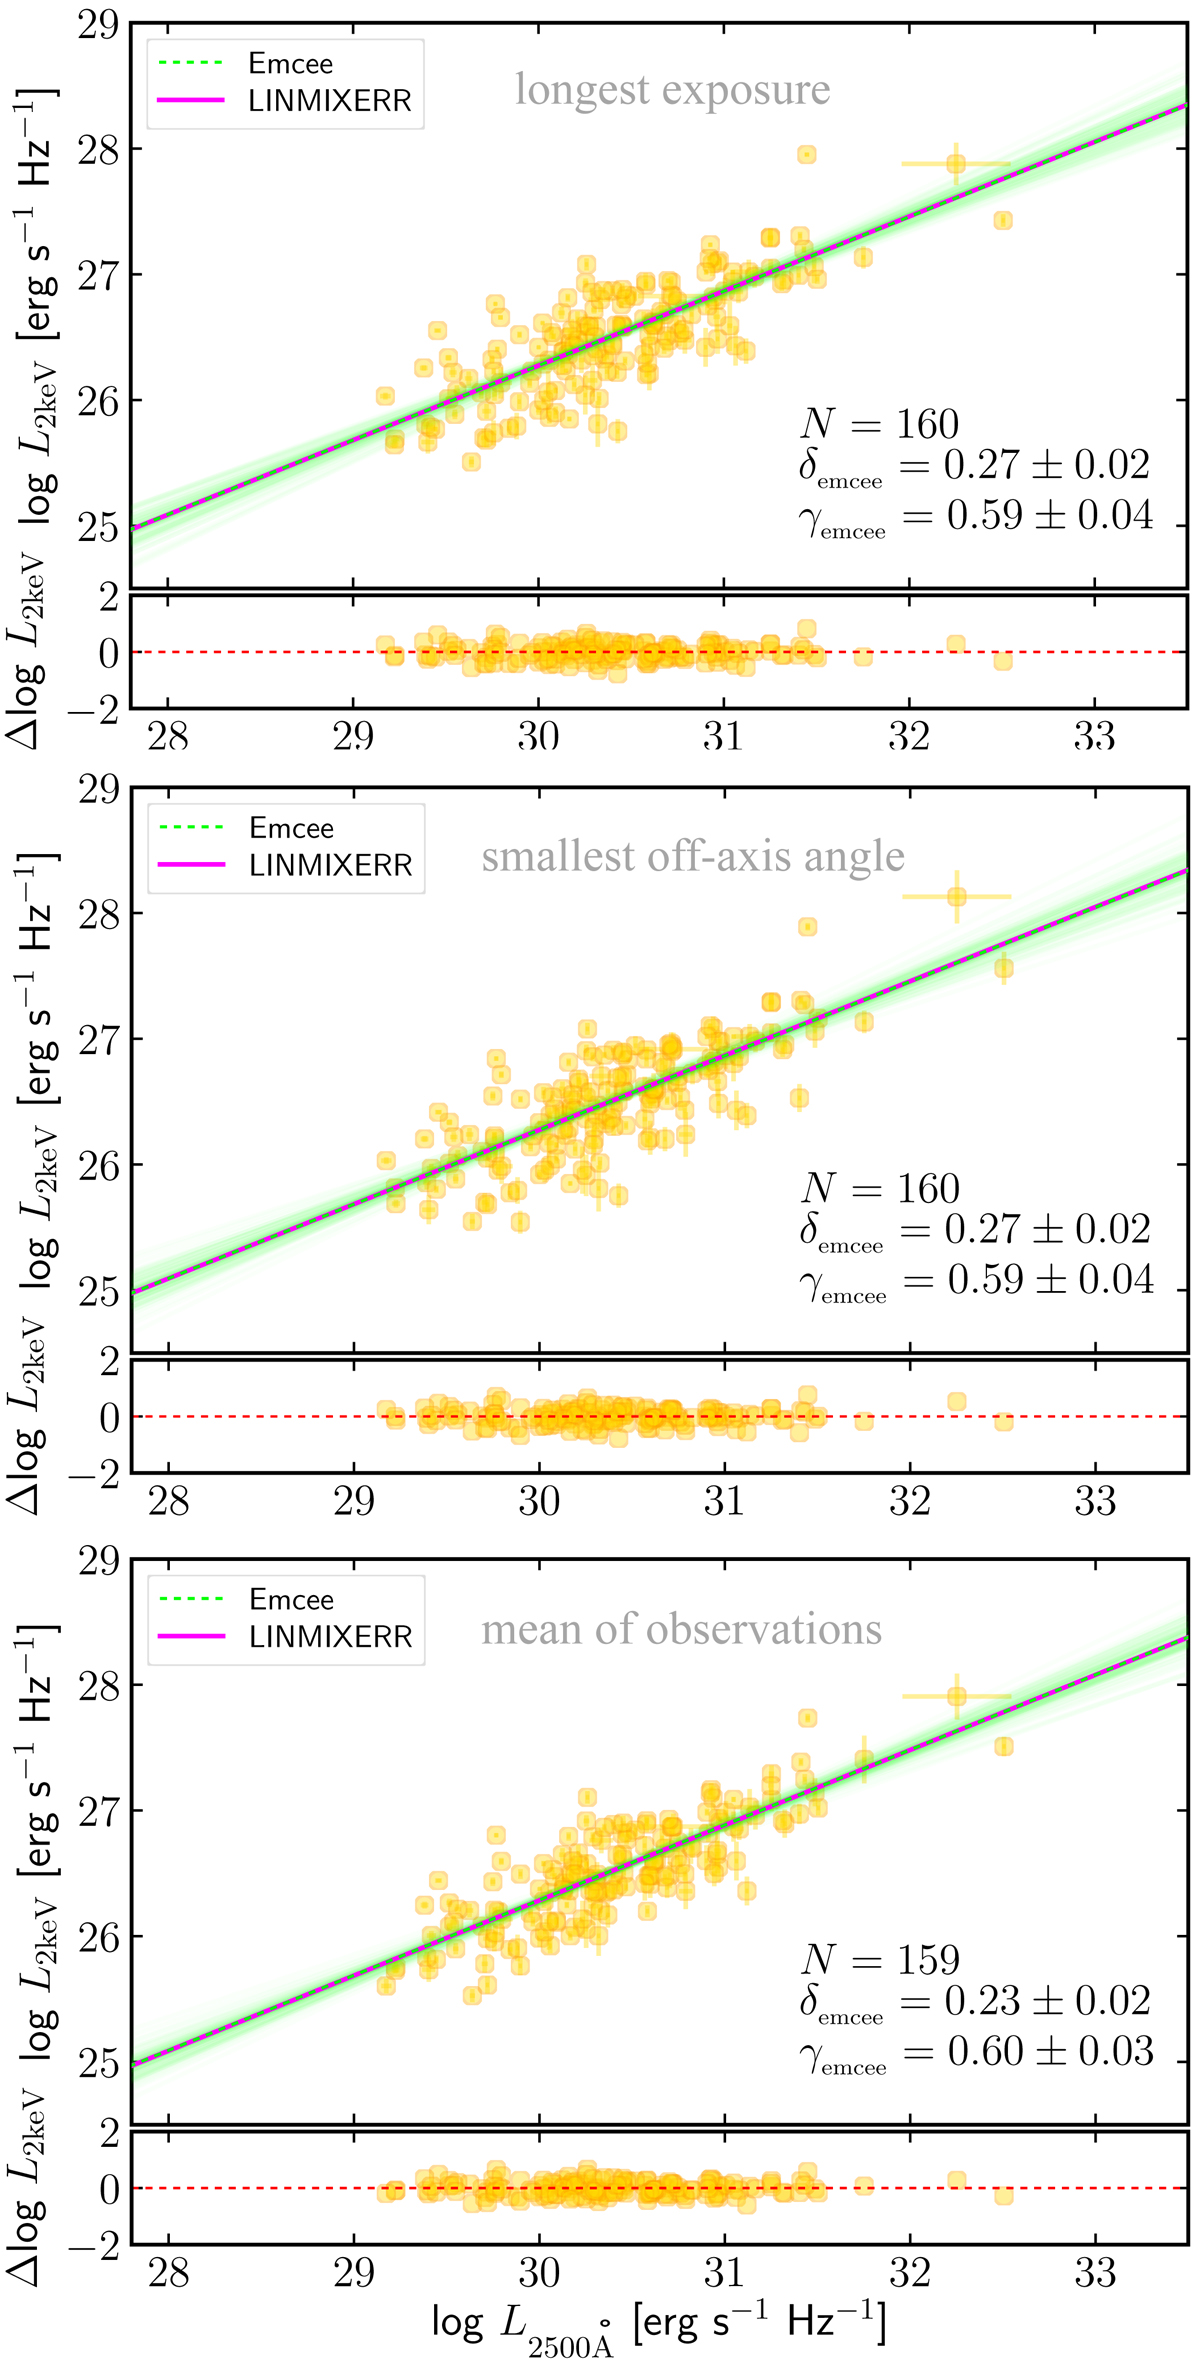
LX − LUV relation for the sub-sample of 160 sources with multiple observations. The X-ray luminosity has been inferred for each source from the longest observation (top panel), from the one with the smallest off-axis angle (middle panel) and from an arithmetic mean of all the fluxes available, that is of all the observations surviving the quality filters that pertain to the single source.
Current usage metrics show cumulative count of Article Views (full-text article views including HTML views, PDF and ePub downloads, according to the available data) and Abstracts Views on Vision4Press platform.
Data correspond to usage on the plateform after 2015. The current usage metrics is available 48-96 hours after online publication and is updated daily on week days.
Initial download of the metrics may take a while.