Free Access
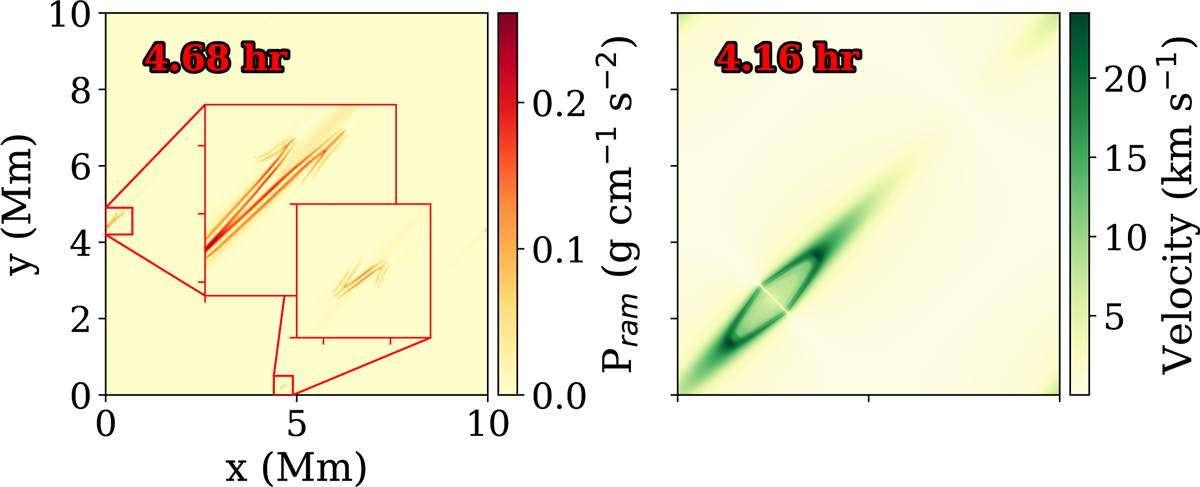
Fig. 5.
Download original image
Left: ram pressure view at the end of the benchmark simulation with insets zoomed in on the filament edges, where ram pressure differences fragment the filament. Right: total velocity magnitude after the filament has formed. It clearly shows the rebound shocks due to the formation of the filament.
Current usage metrics show cumulative count of Article Views (full-text article views including HTML views, PDF and ePub downloads, according to the available data) and Abstracts Views on Vision4Press platform.
Data correspond to usage on the plateform after 2015. The current usage metrics is available 48-96 hours after online publication and is updated daily on week days.
Initial download of the metrics may take a while.