Fig. 4.
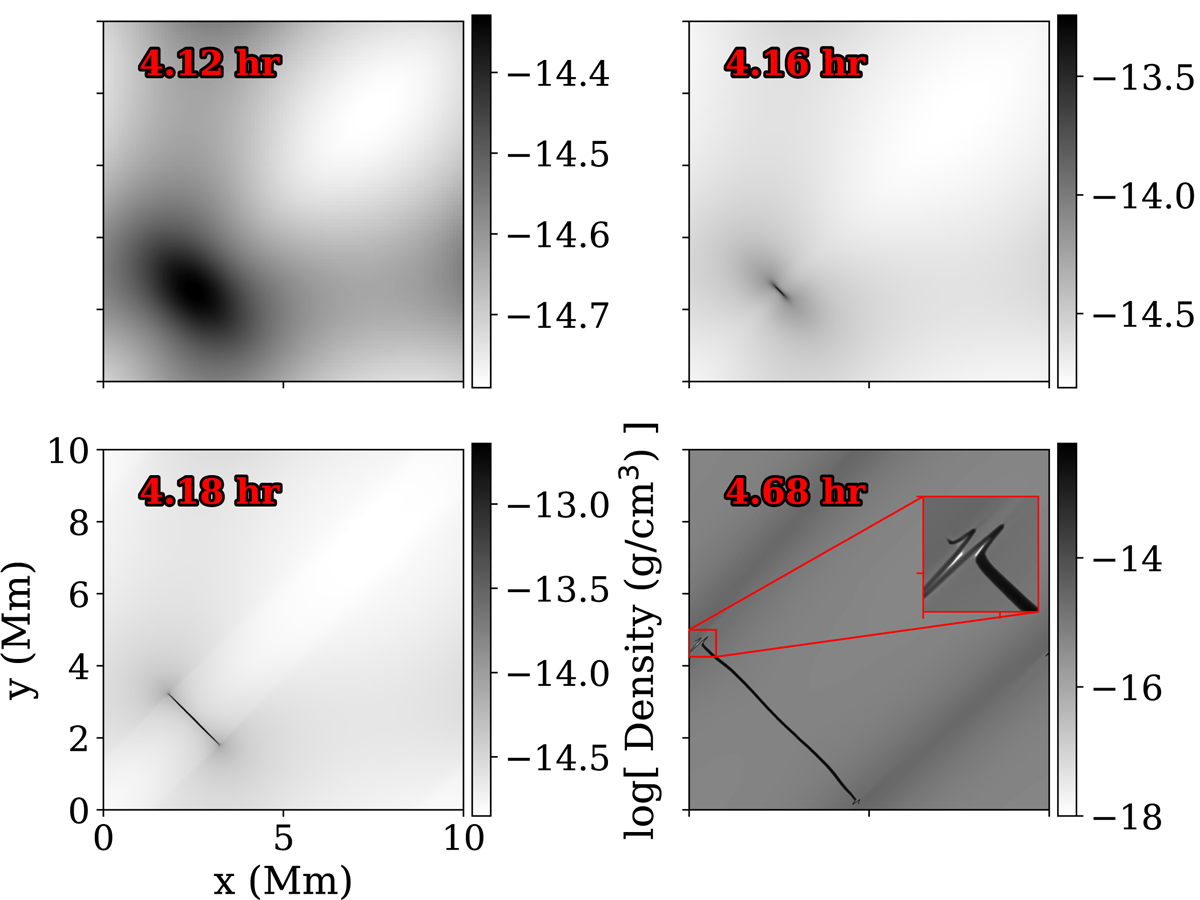
Download original image
Density view of the benchmark simulation using the SPEX_DM table and a resolution of 32002. The top left and right panels have a density of twice and twenty times the background value, respectively. The bottom left panel has a density of 95 times the background value, and the bottom right panel denotes the end of the simulation due to the small time-step restriction.
Current usage metrics show cumulative count of Article Views (full-text article views including HTML views, PDF and ePub downloads, according to the available data) and Abstracts Views on Vision4Press platform.
Data correspond to usage on the plateform after 2015. The current usage metrics is available 48-96 hours after online publication and is updated daily on week days.
Initial download of the metrics may take a while.