Free Access
Fig. 2.
Download original image
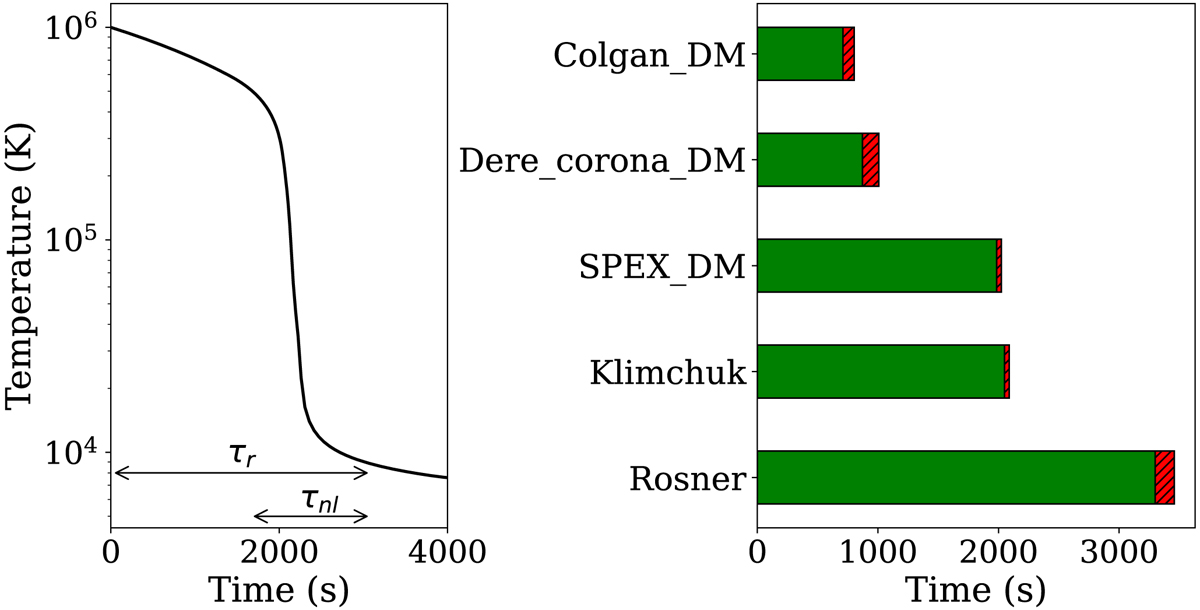
Left: general thermal evolution of thermal instability and its timescales. Right: linear and non-linear timescales of five cooling curves. The linear timescale is depicted by the length of the full bar, and the non-linear part is represented by the red part.
Current usage metrics show cumulative count of Article Views (full-text article views including HTML views, PDF and ePub downloads, according to the available data) and Abstracts Views on Vision4Press platform.
Data correspond to usage on the plateform after 2015. The current usage metrics is available 48-96 hours after online publication and is updated daily on week days.
Initial download of the metrics may take a while.