Fig. 17.
Download original image
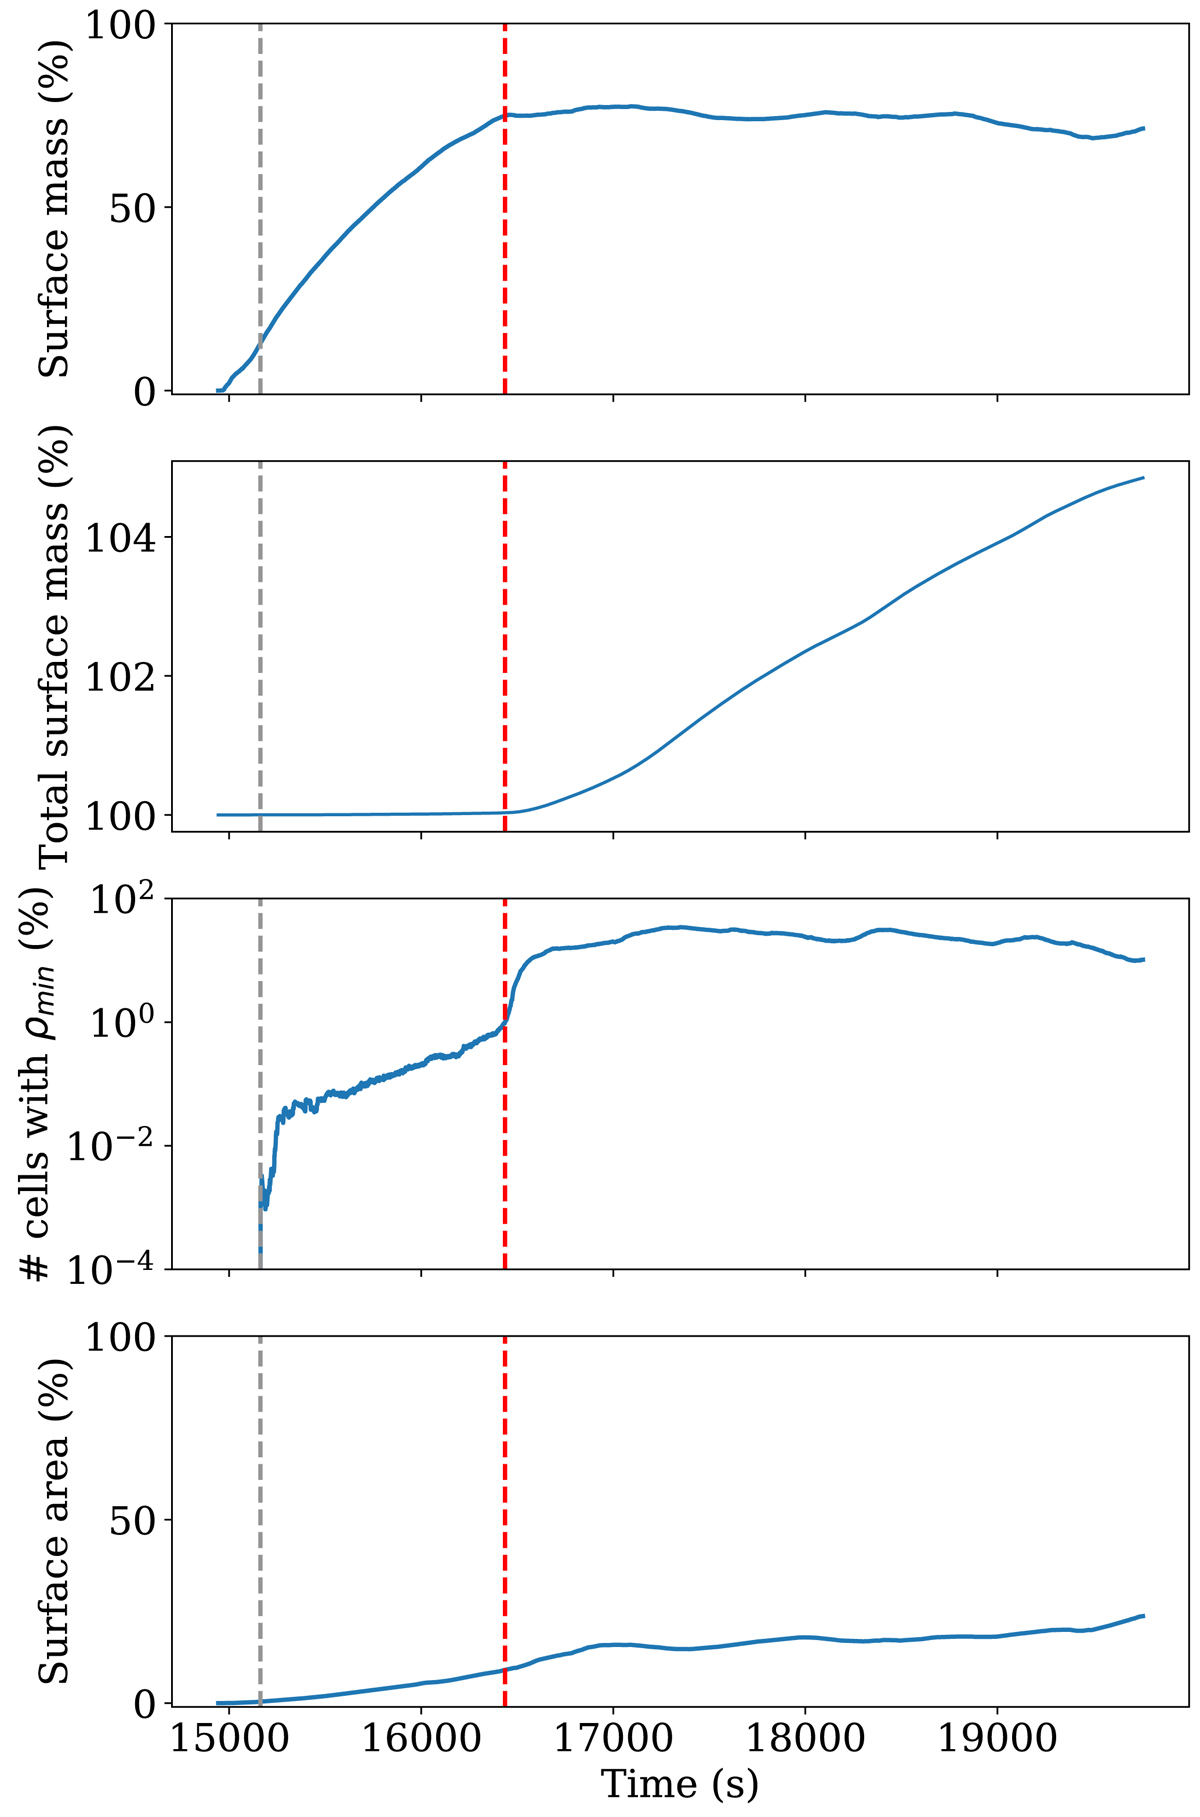
Top panel: evolution of the surface mass of the filament. Second panel: evolution of the total surface mass in the grid. Third panel: evolution of the percentage of the number of cells or area with the prescribed lowest allowed density. Bottom panel: evolution of the surface area of the filament with respect to the total area.
Current usage metrics show cumulative count of Article Views (full-text article views including HTML views, PDF and ePub downloads, according to the available data) and Abstracts Views on Vision4Press platform.
Data correspond to usage on the plateform after 2015. The current usage metrics is available 48-96 hours after online publication and is updated daily on week days.
Initial download of the metrics may take a while.