Fig. 15.
Download original image
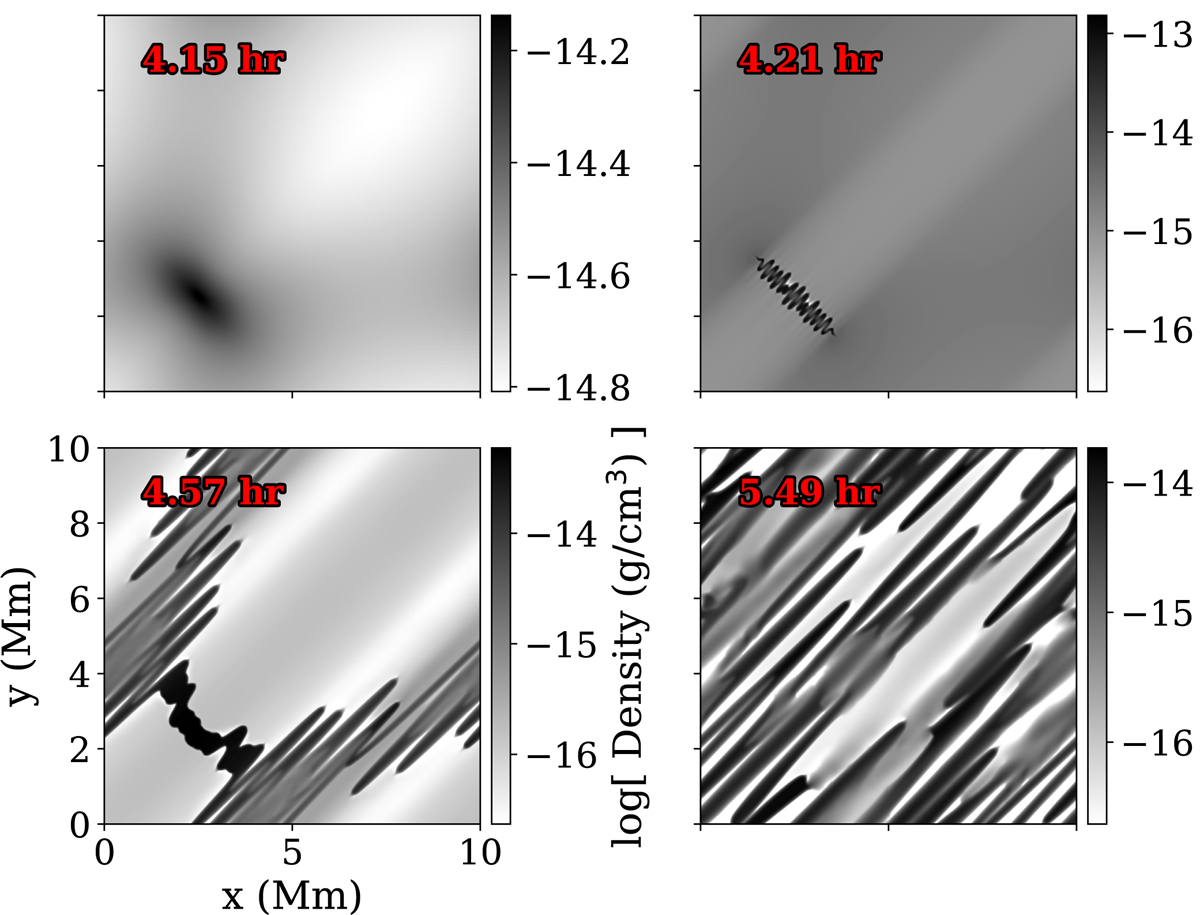
Density view of the full evolution of the thermal instability. Top row: onset of the thermal instability and the moment in which the low-density bootstrap measure kicks in, in the left and right panel, respectively. Bottom left: moment in which 1% of the area is at the prescribed lowest allowed density. Bottom right: last moment of the simulation. The animation of this simulation is available online.
Current usage metrics show cumulative count of Article Views (full-text article views including HTML views, PDF and ePub downloads, according to the available data) and Abstracts Views on Vision4Press platform.
Data correspond to usage on the plateform after 2015. The current usage metrics is available 48-96 hours after online publication and is updated daily on week days.
Initial download of the metrics may take a while.