Fig. 12.
Download original image
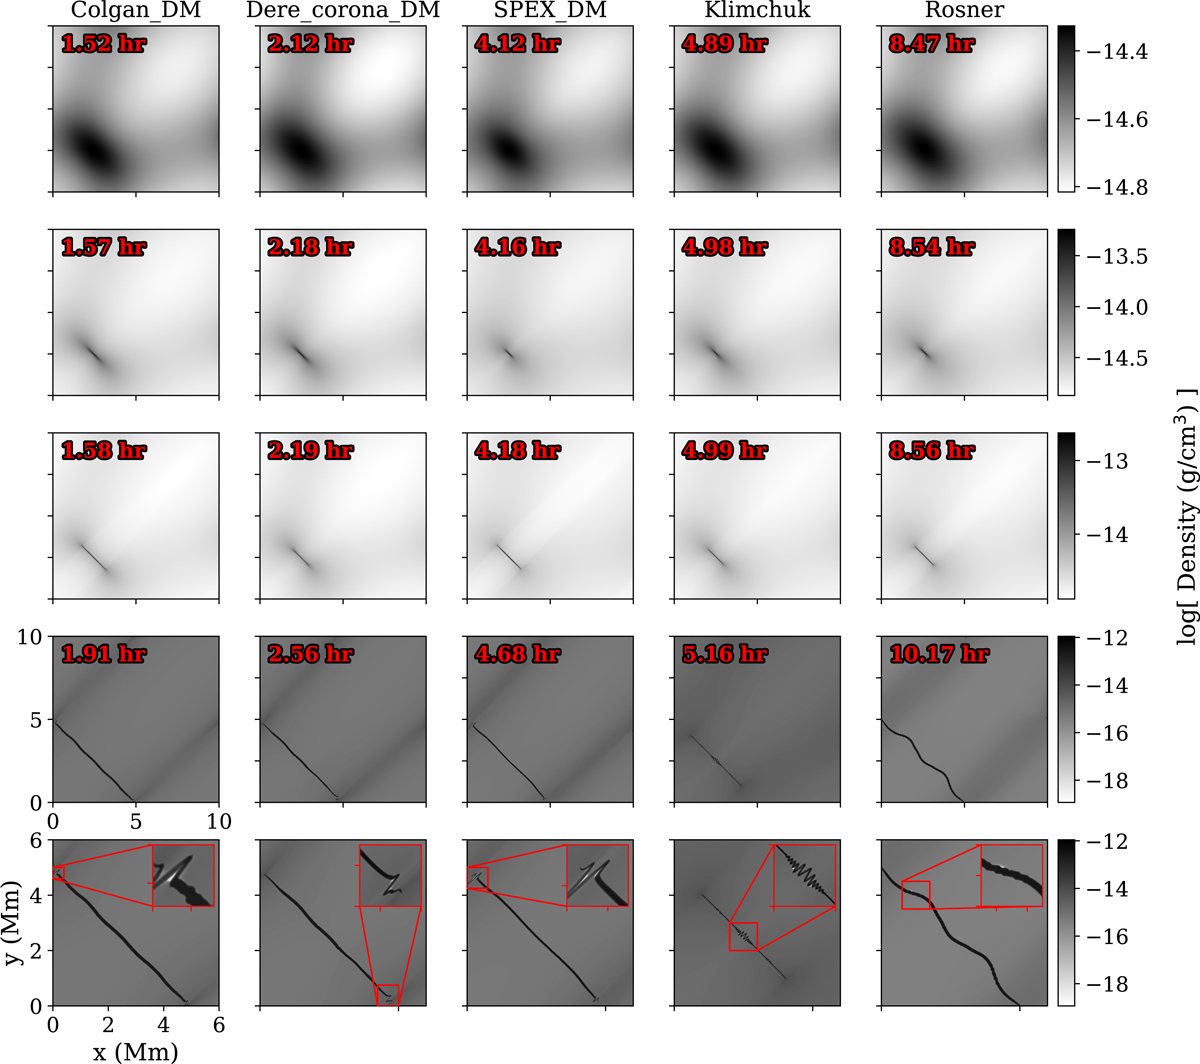
Density views during the simulations with different cooling curves. Each cooling curve has its own column. The rows represent similar moments and are scaled to the same density colour bar. The first three rows are when the filament has a maximum density of approximately 2, 20, and 95 times the background density. The fourth row is the last moment, at which the time step becomes restrictive. The last row is a zoom-in onto the filament of the last moment, it also contains a zoomed-in inset of the low-density region.
Current usage metrics show cumulative count of Article Views (full-text article views including HTML views, PDF and ePub downloads, according to the available data) and Abstracts Views on Vision4Press platform.
Data correspond to usage on the plateform after 2015. The current usage metrics is available 48-96 hours after online publication and is updated daily on week days.
Initial download of the metrics may take a while.