Free Access
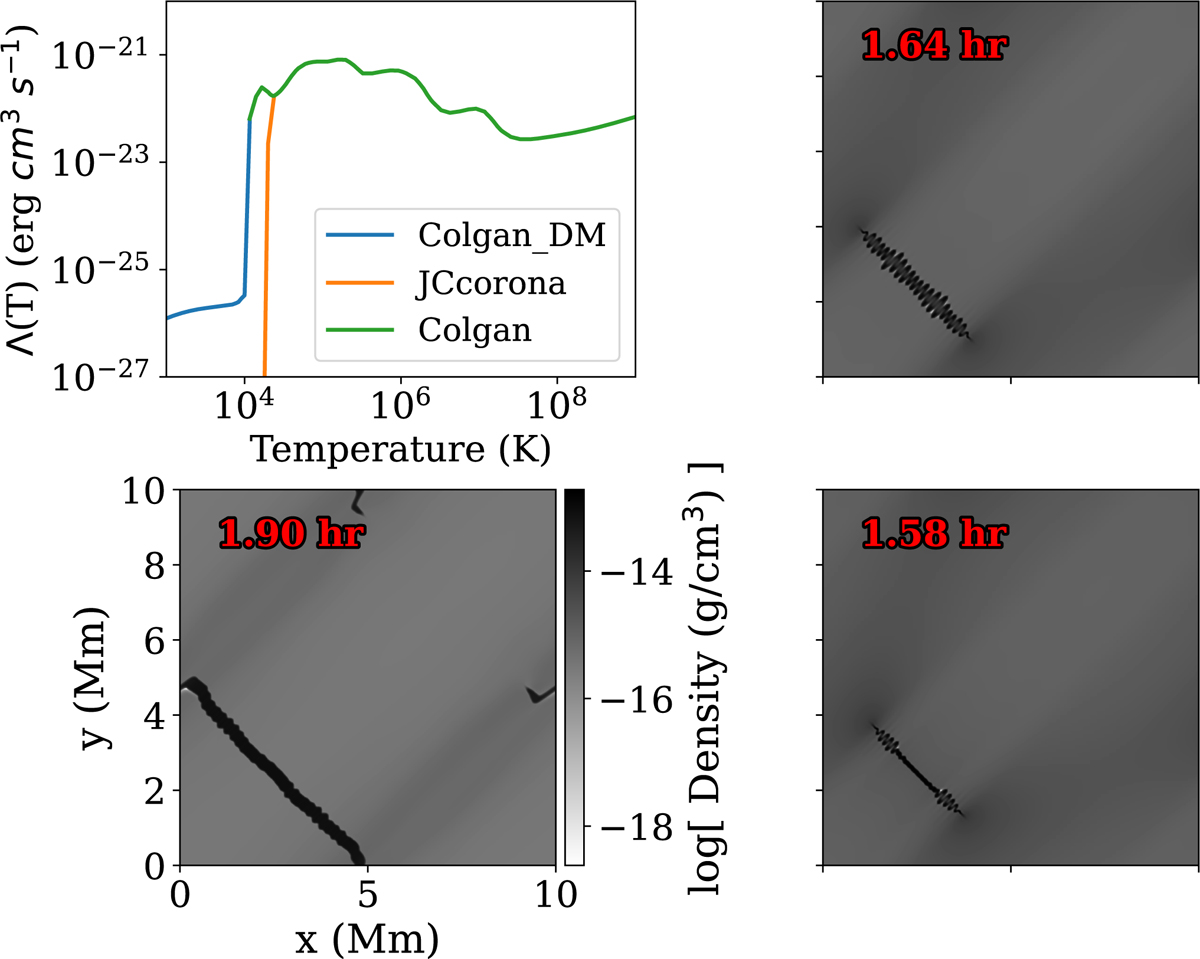
Fig. 10.
Download original image
Three cooling curves with different low-temperature treatment and their density view at the end of the evolution. Top left: cooling curves. Top right to bottom left and bottom right: density views at the end of the evolution. They correspond to the Colgan_DM, JCcorona, and Colgan cooling tables, respectively.
Current usage metrics show cumulative count of Article Views (full-text article views including HTML views, PDF and ePub downloads, according to the available data) and Abstracts Views on Vision4Press platform.
Data correspond to usage on the plateform after 2015. The current usage metrics is available 48-96 hours after online publication and is updated daily on week days.
Initial download of the metrics may take a while.