Free Access
Fig. 3.
Download original image
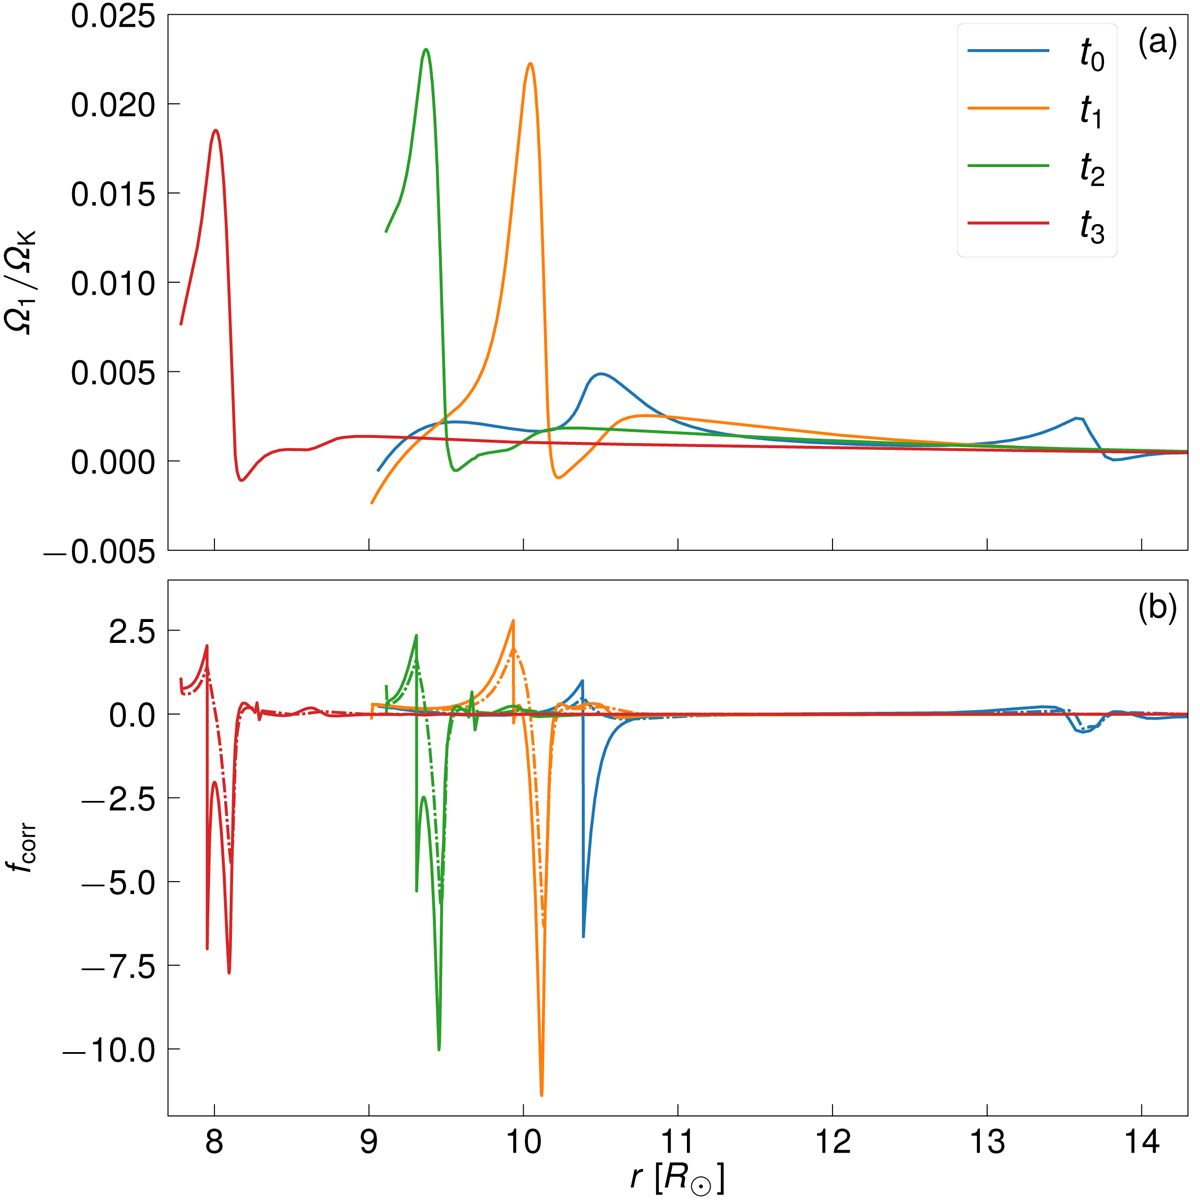
a: Ω1 waves for four different, arbitrarily chosen times t0 to t3 during the onset of a FU Ori-like outburst. b: correction factors as defined in Eq. (41) for the same times as in (a). The dashed-dotted lines correspond to the first term in Eq. (41), whereas the full lines show the total value of fcorr.
Current usage metrics show cumulative count of Article Views (full-text article views including HTML views, PDF and ePub downloads, according to the available data) and Abstracts Views on Vision4Press platform.
Data correspond to usage on the plateform after 2015. The current usage metrics is available 48-96 hours after online publication and is updated daily on week days.
Initial download of the metrics may take a while.