Free Access
Fig. 6.
Download original image
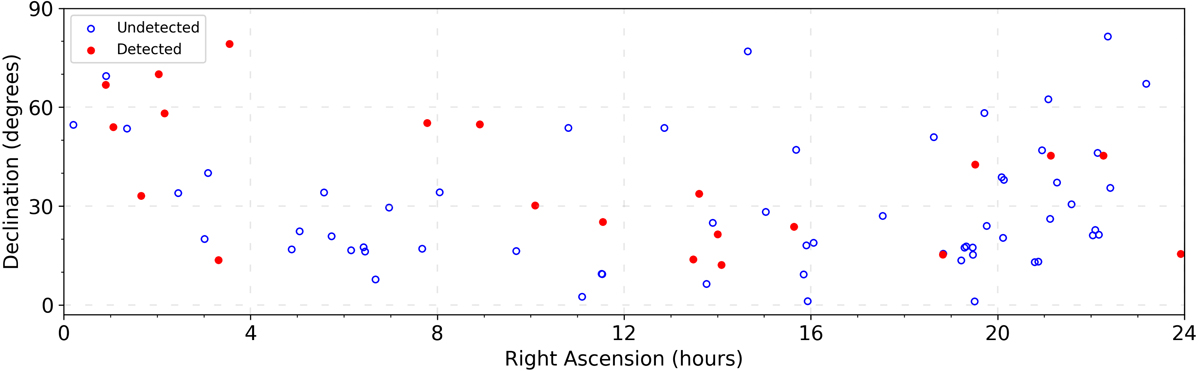
Overview of the sky positions of the RRATs observed during the census discussed in Sect. 4.2 as of May 2021. Filled red dots indicate sources that have been observed and detected with either single pulses or periodic emission while blue circles indicate sources that were observed but not detected in I-LOFAR data.
Current usage metrics show cumulative count of Article Views (full-text article views including HTML views, PDF and ePub downloads, according to the available data) and Abstracts Views on Vision4Press platform.
Data correspond to usage on the plateform after 2015. The current usage metrics is available 48-96 hours after online publication and is updated daily on week days.
Initial download of the metrics may take a while.