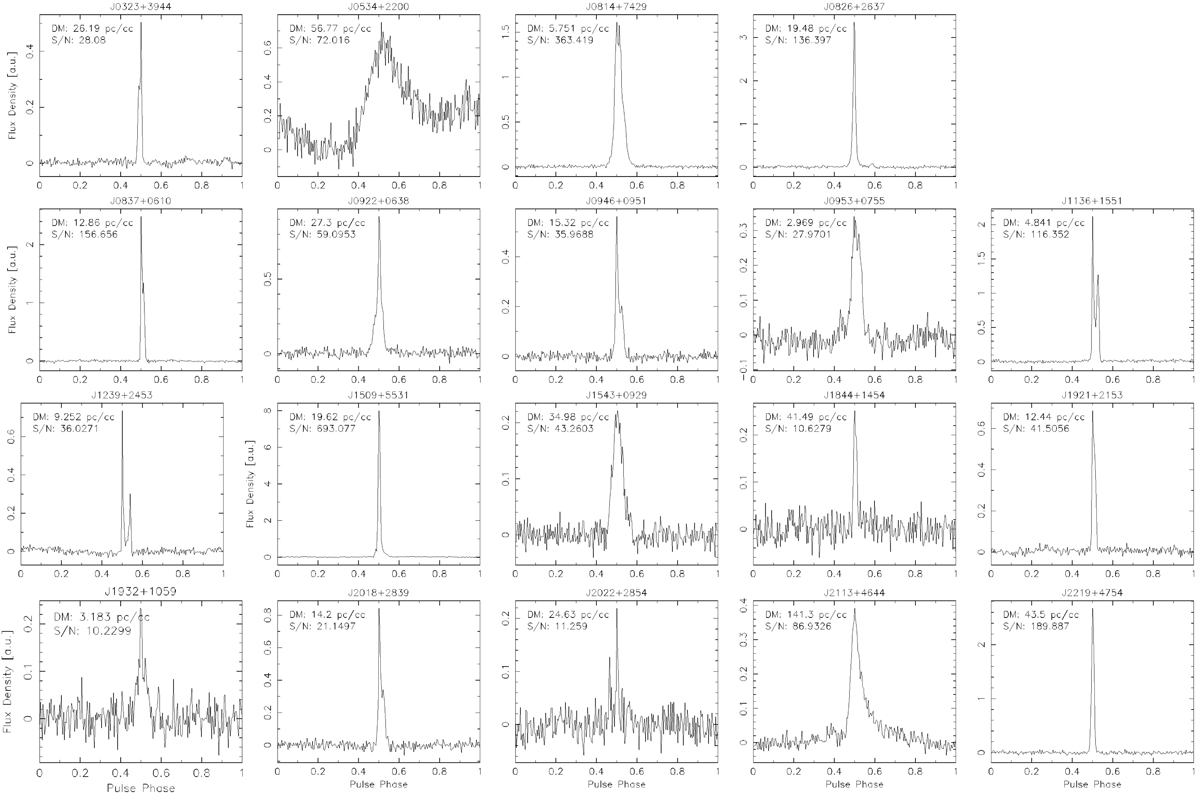
Fig. 4.
Download original image
Sample of 19 pulsars observed with I-LOFAR and REALTA. Each of these observations is 6 min in duration and were taken on 4–5 March 2020 using the HBA antennas (110–190 MHz ). The data were processed using the method described in Sect. 3.3 and plotted using PSRCHIVE. The x-axis in each plot is the pulse phase in radians, while the y-axis is flux density in arbitrary units.
Current usage metrics show cumulative count of Article Views (full-text article views including HTML views, PDF and ePub downloads, according to the available data) and Abstracts Views on Vision4Press platform.
Data correspond to usage on the plateform after 2015. The current usage metrics is available 48-96 hours after online publication and is updated daily on week days.
Initial download of the metrics may take a while.