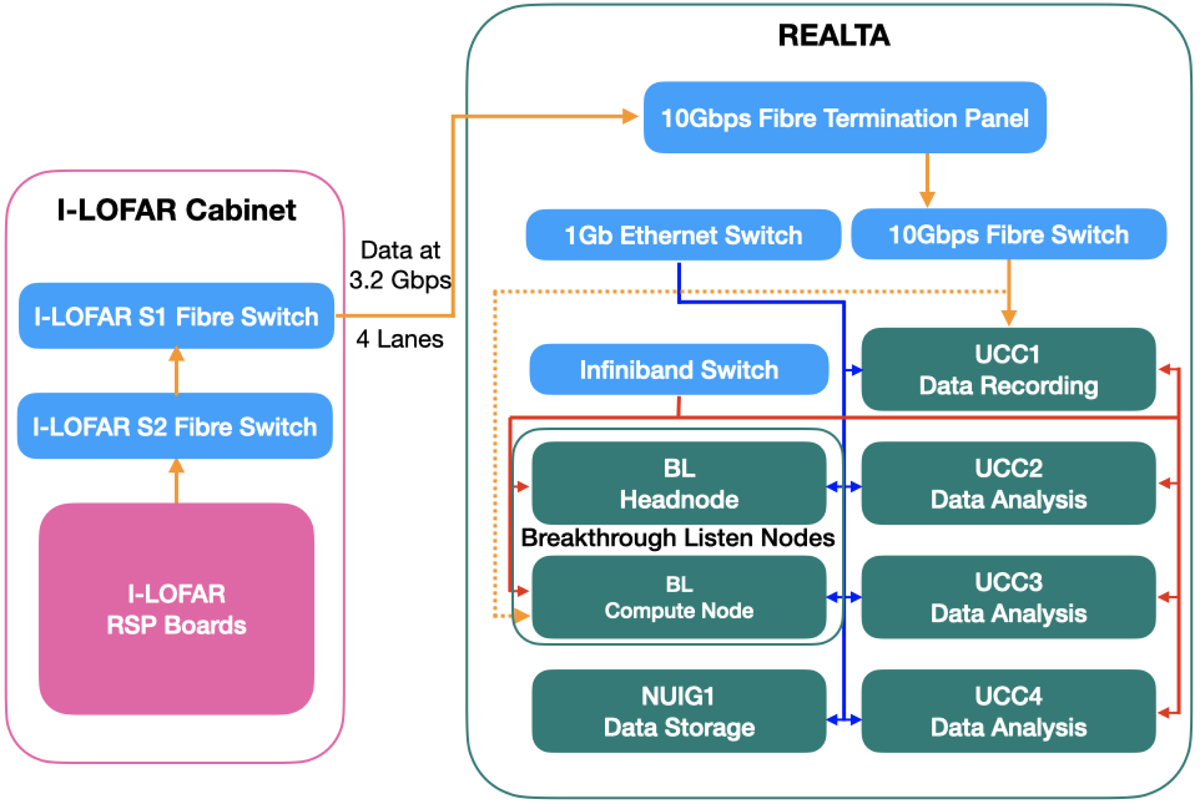
Fig. 2.
Download original image
Block diagram for REALTA and I-LOFAR. Data recorded at the Remote Station Processing (RSP) boards are sent to the S1 fibre switch in the I-LOFAR container. Here the data are split into four ‘lanes’ where each lane contains the data from a maximum of one quarter of the beamlets from the observation. The four lanes of data are then sent over a fibre connection to the I-LOFAR control room where it is recorded by REALTA. Orange arrows indicate the data path along fibre connections. Blue arrows are 1 Gbps Ethernet links and red arrows show infiniband connectivity. The dotted orange line is a fibre link to the BL compute node currently under development.
Current usage metrics show cumulative count of Article Views (full-text article views including HTML views, PDF and ePub downloads, according to the available data) and Abstracts Views on Vision4Press platform.
Data correspond to usage on the plateform after 2015. The current usage metrics is available 48-96 hours after online publication and is updated daily on week days.
Initial download of the metrics may take a while.