Fig. 9.
Download original image
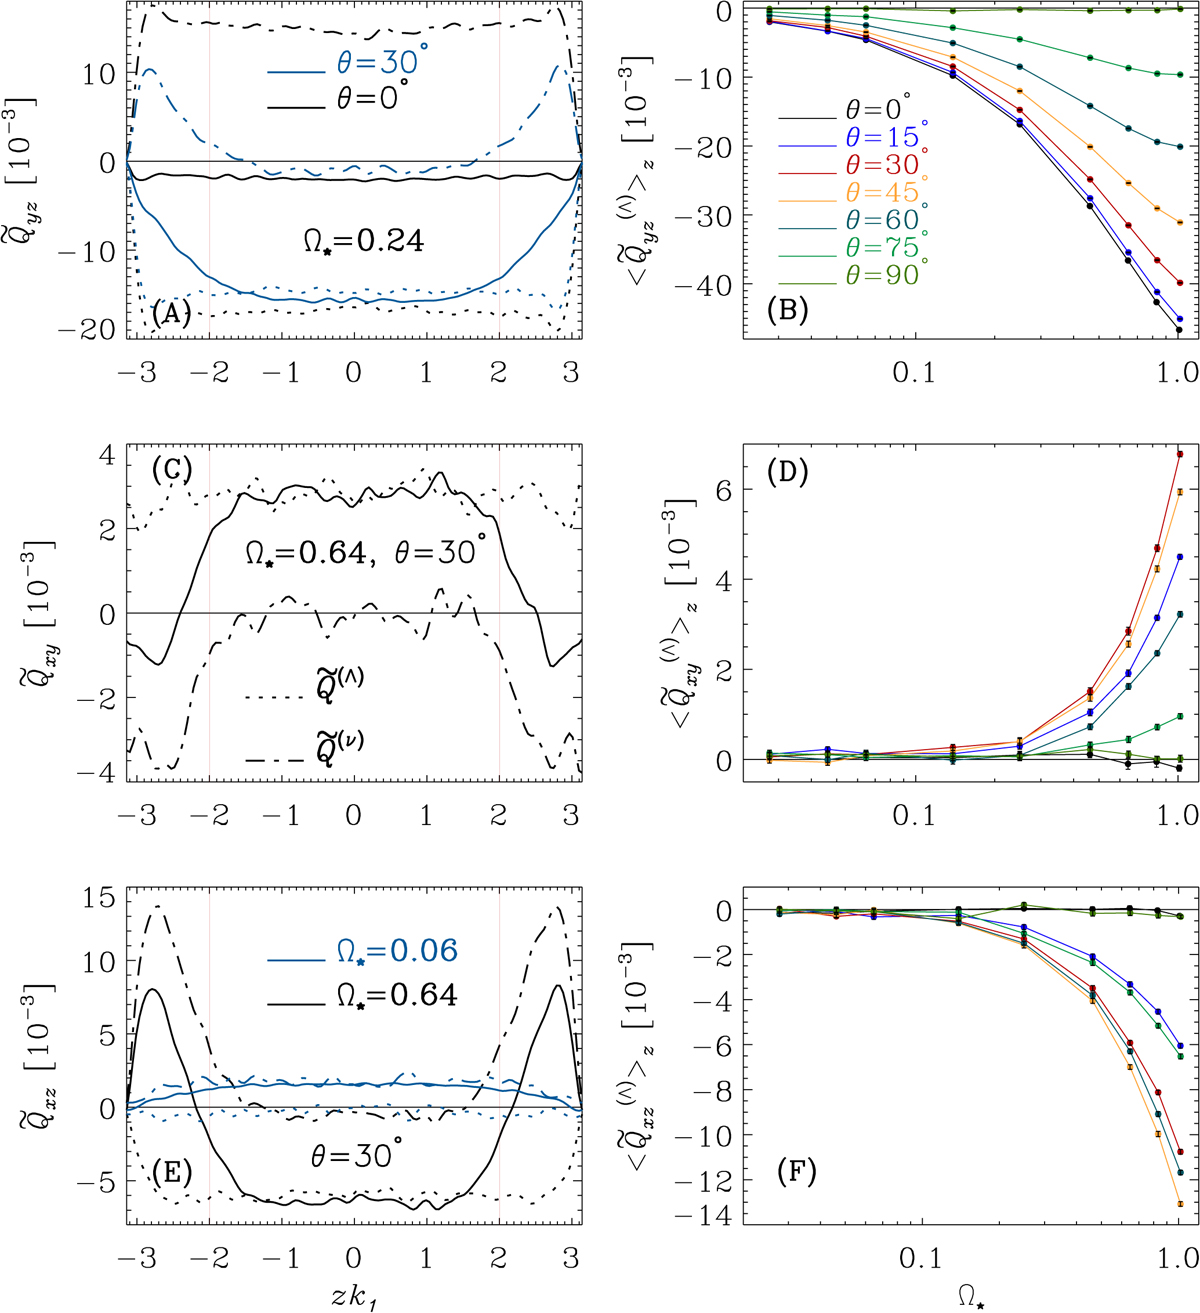
Panels A, C, and E: time-averaged diffusive and nondiffusive parts of the Reynolds stresses vs. vertical direction. The black and blue lines in panel A show the normalized vertical stresses at the equator and a latitude of 30° for set C24, respectively. In panel C the horizontal stresses are shown at a latitude of 30° for set C64. The blue and black lines in panel E show the meridional stresses for sets C06 and C64 at a latitude of 30°, respectively. The vertical lines denotes the z range used for volume averages. Solid, dotted, and dash-dotted lines show ![]() ,
, ![]() , and
, and ![]() , respectively. Panels B, D, and F: Volume averages over −2 ≤ zk1 ≤ 2, of
, respectively. Panels B, D, and F: Volume averages over −2 ≤ zk1 ≤ 2, of ![]() vs. Ω⋆ at different latitudes as indicated by the legend.
vs. Ω⋆ at different latitudes as indicated by the legend.
Current usage metrics show cumulative count of Article Views (full-text article views including HTML views, PDF and ePub downloads, according to the available data) and Abstracts Views on Vision4Press platform.
Data correspond to usage on the plateform after 2015. The current usage metrics is available 48-96 hours after online publication and is updated daily on week days.
Initial download of the metrics may take a while.