Fig. A.3
Download original image
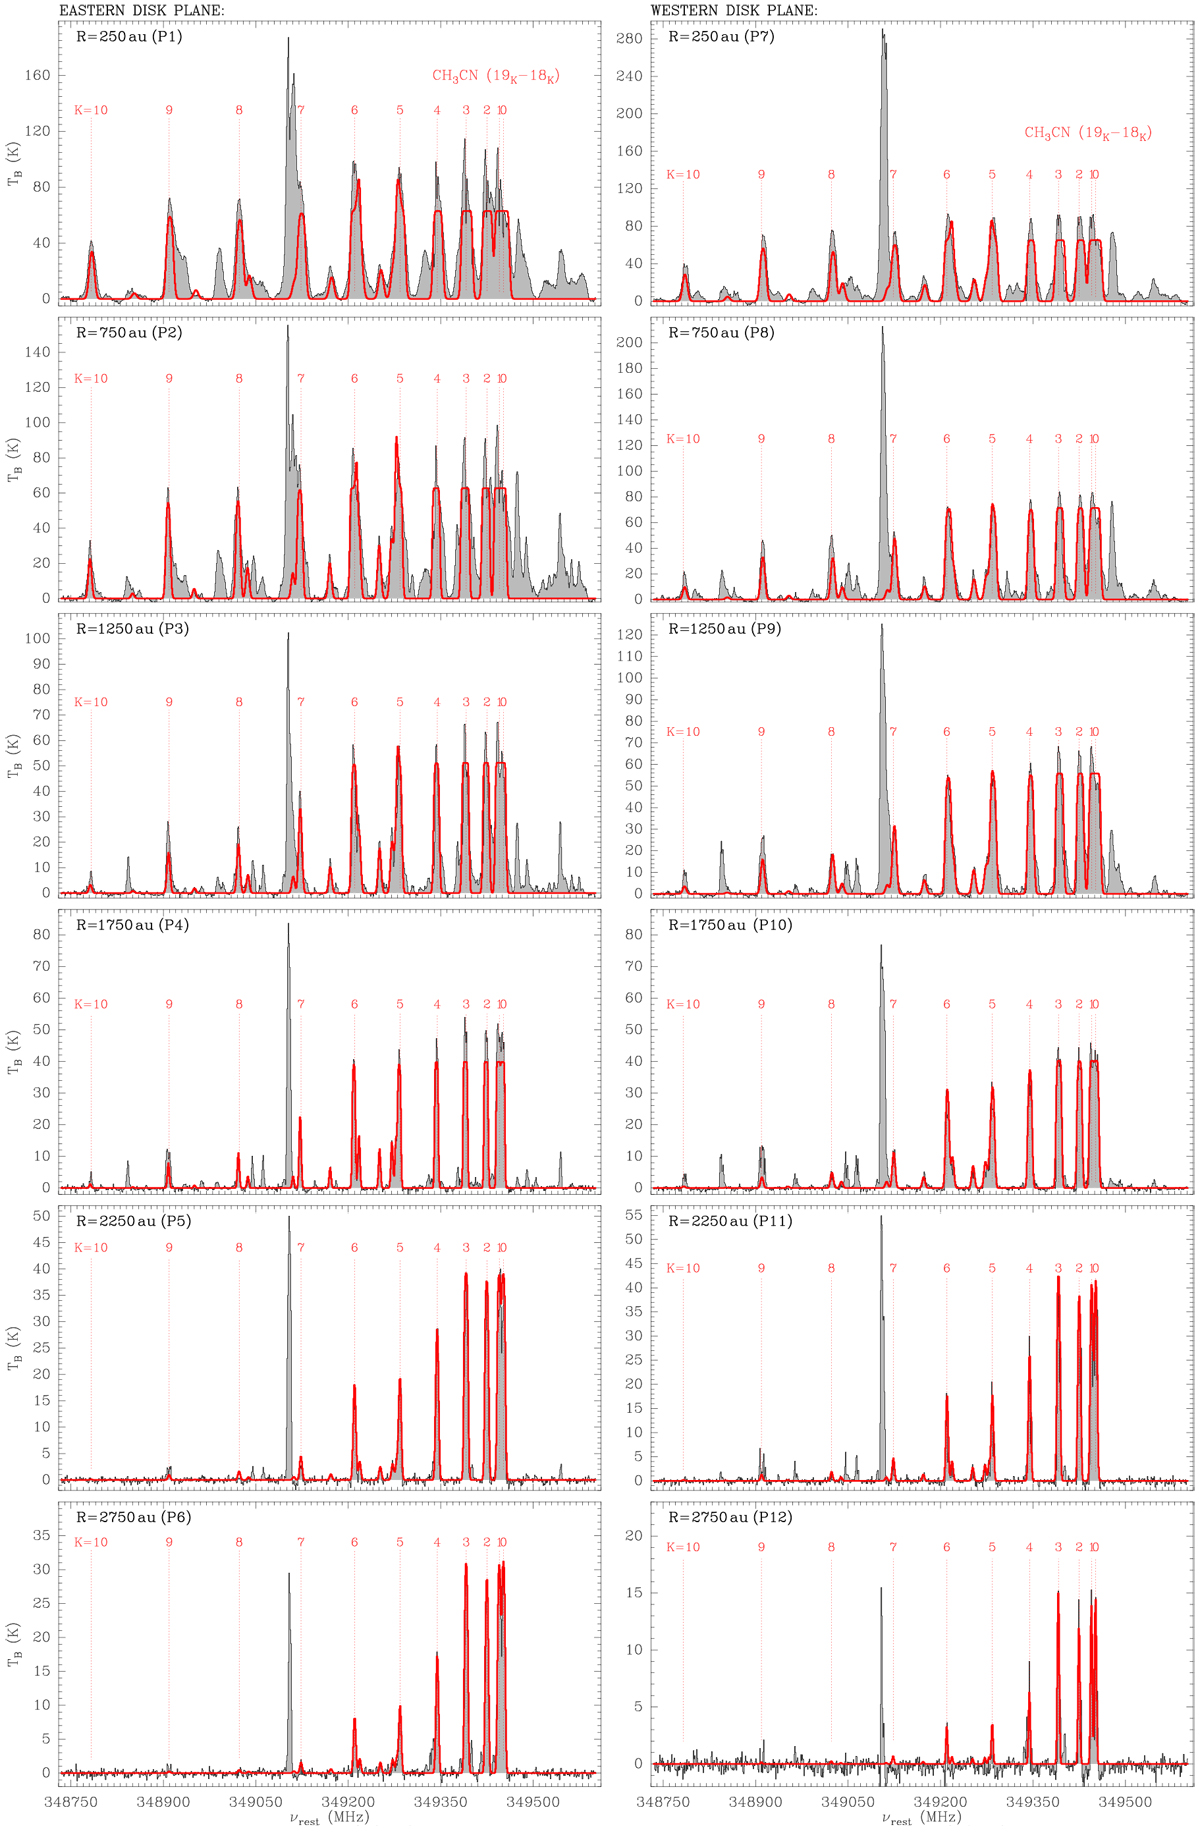
Spectra of the CH3CN (19K–18K) transitions along the eastern (left column) and western (right column) sides of the disk plane. Spectra are integrated at radial steps of 500 au as indicated in Fig. 1, and each pointing is labelled on the top left accordingly. The CH3CN components, with K ranging from 0 to 10, are marked in red in each spectrum. The brightest line at a rest frequency of 349.107 GHz corresponds to the CH3OH (141,13–141,14) A+ emission imaged in Fig. 2. Modelled spectra are overplotted in red; we note that the first four K components were not fitted, except at positions P6 and P12 (cf. Sect. 3).
Current usage metrics show cumulative count of Article Views (full-text article views including HTML views, PDF and ePub downloads, according to the available data) and Abstracts Views on Vision4Press platform.
Data correspond to usage on the plateform after 2015. The current usage metrics is available 48-96 hours after online publication and is updated daily on week days.
Initial download of the metrics may take a while.