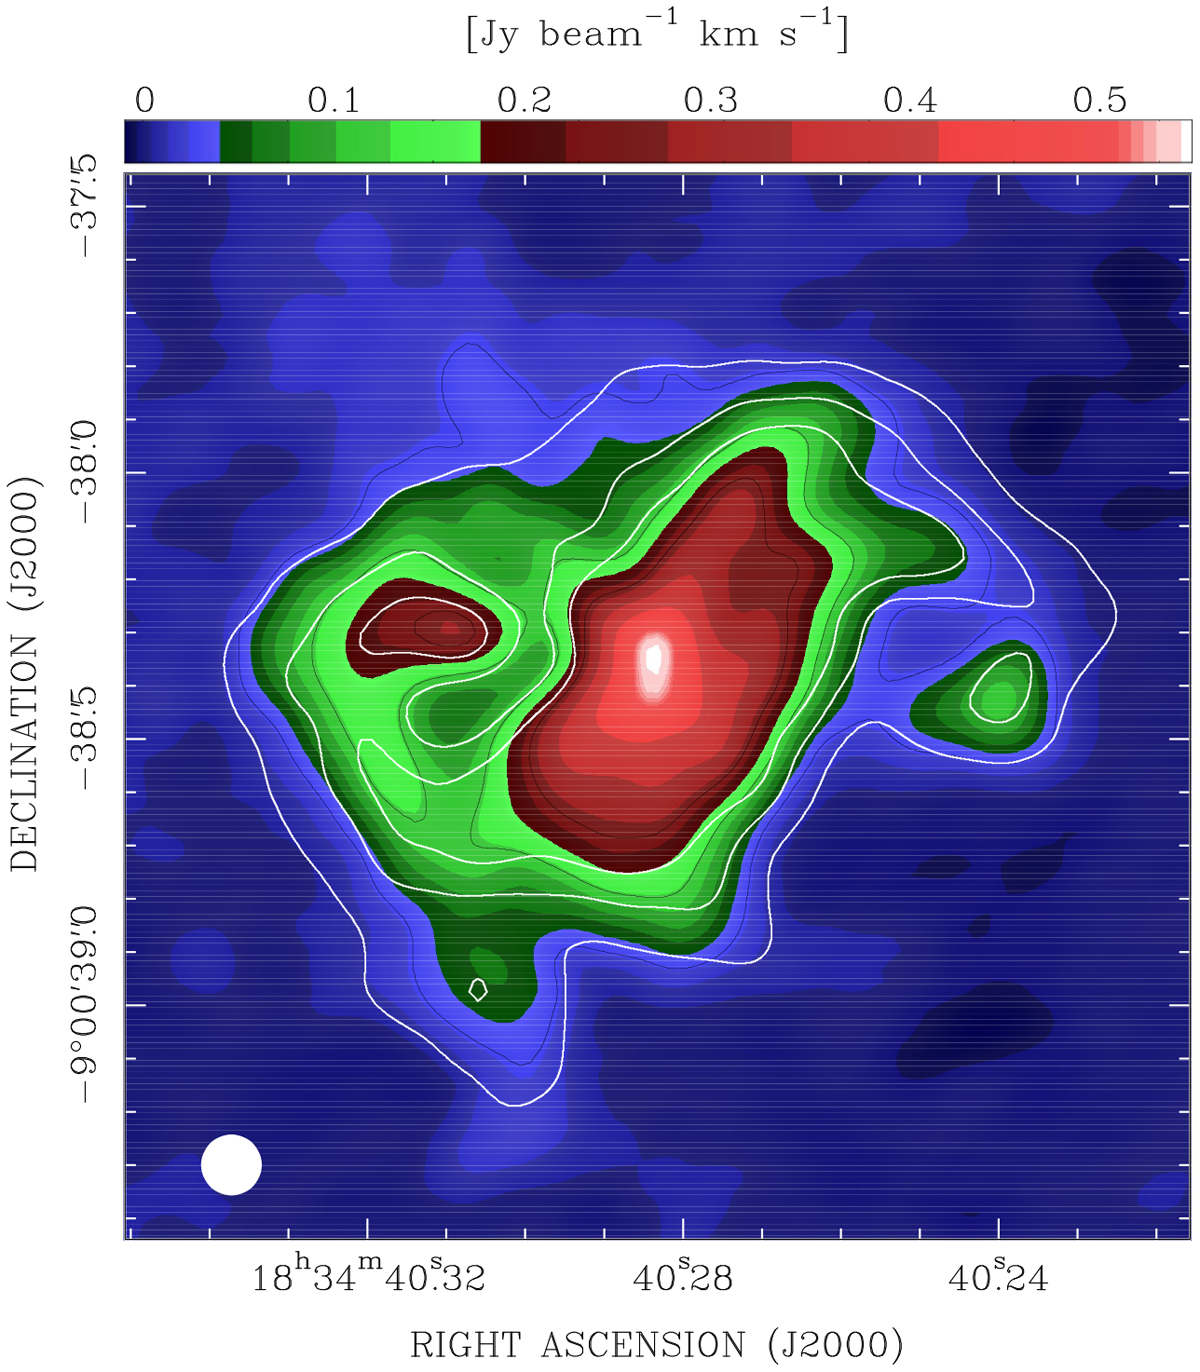
Fig. A.1
Download original image
Moment-zero map of the CH3CN (194–184) emission (colours and black contours) for a direct comparison with the CH3OH (141,13–140,14) A+ emission of Fig. 1 (white contours). These CH3CN and CH3OH transitions have similar excitation energies (Eup) of 281.9 K and 260.2 K, respectively, and the line emission has been integrated over the same velocity range. The upper wedge quantifies the line intensity from its peak to the maximum negative in the map; black contours are drawn at levels of 10, 50, and 100 times the 1 σ rms of 2.5 mJy beam−1 km s−1. We note that the white and black contours should be used for a direct comparison between the spatial morphology of the CH3OH and CH3CN emissions, respectively, because they correspond to relative levels of comparable rms (at variance with the colour map which depends on the maximum in the map). The synthesized ALMA beam is shown in the bottom left corner.
Current usage metrics show cumulative count of Article Views (full-text article views including HTML views, PDF and ePub downloads, according to the available data) and Abstracts Views on Vision4Press platform.
Data correspond to usage on the plateform after 2015. The current usage metrics is available 48-96 hours after online publication and is updated daily on week days.
Initial download of the metrics may take a while.