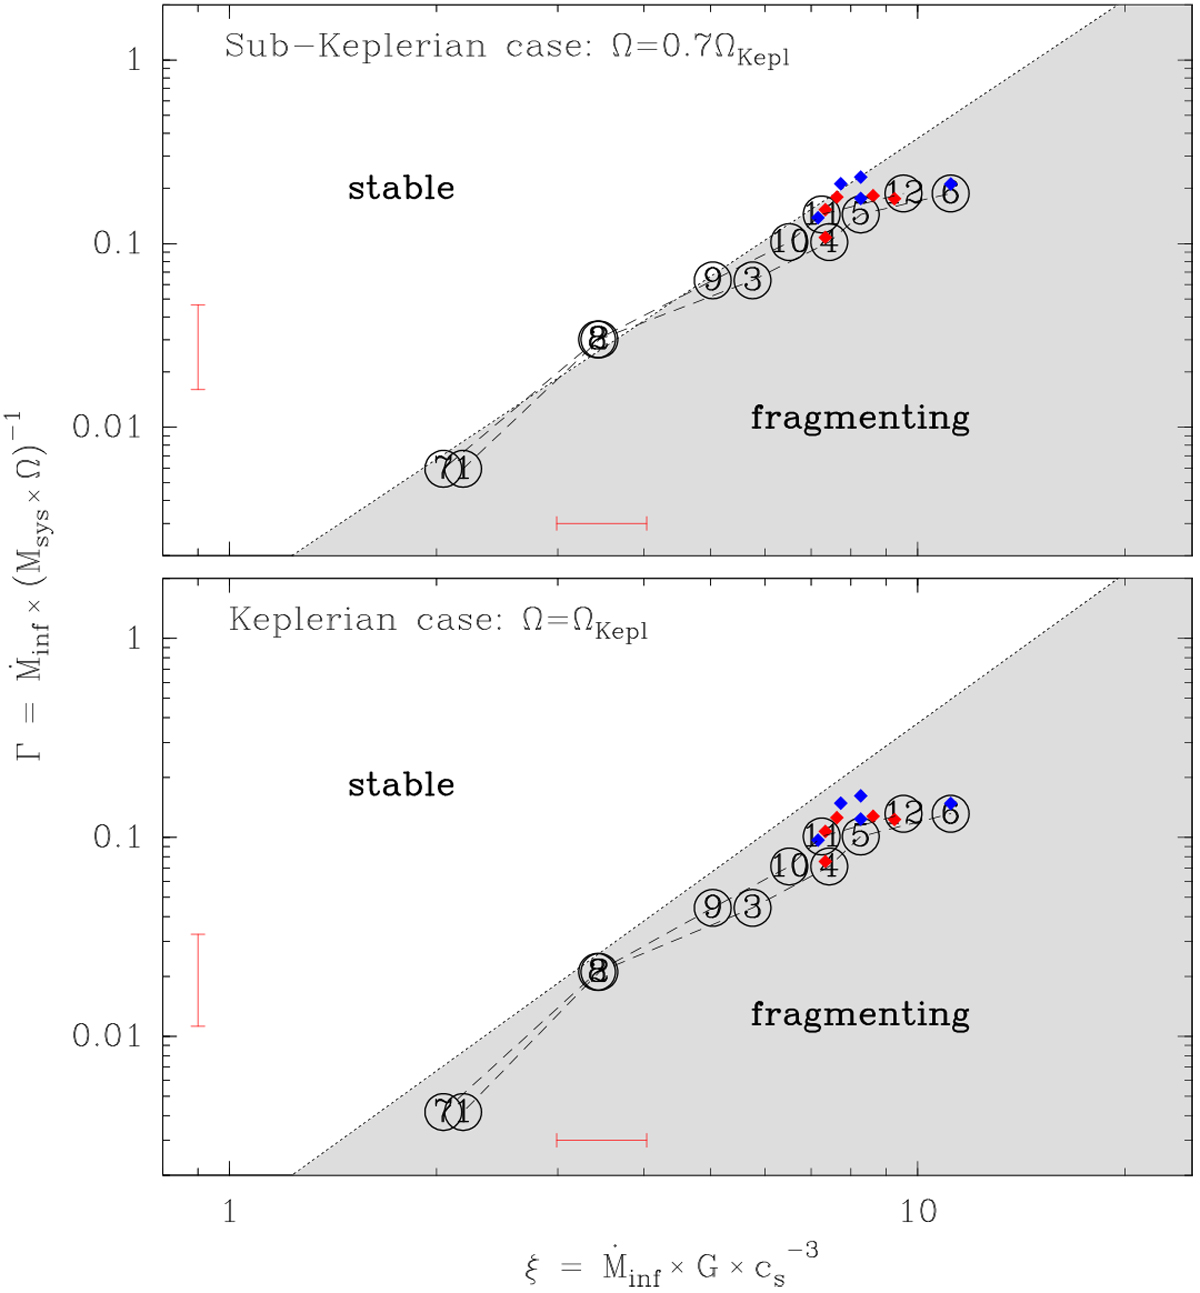
Fig. 5
Download original image
Analysis of the disk stability against local fragmentation, following the methodology outlined in Kratter et al. (2010). The plot reports the dependence of two dimensionless parameters, Γ and ξ, whose relation defines two regions where the disk is stable (white) or prone to fragmentation (grey). Black empty circles mark the local values of Γ and ξ within the midlplane and they are labelled according to the pointing numbers in Table 2 (P2 and P8 overlap); red and blue diamonds mark values for the north-eastern and south-western apparent spirals, respectively. The upper and lower plots compare the behaviour of an angular velocity (Ω) which is either 70% of the Keplerian value (upper), or equal to it (lower). Reference error bars are indicated in red for an inner position (largest ticks in logarithmic scale), and they account for a 10% uncertainty in the local temperature and a positional uncertainty of half the beam size.
Current usage metrics show cumulative count of Article Views (full-text article views including HTML views, PDF and ePub downloads, according to the available data) and Abstracts Views on Vision4Press platform.
Data correspond to usage on the plateform after 2015. The current usage metrics is available 48-96 hours after online publication and is updated daily on week days.
Initial download of the metrics may take a while.