Fig. 4
Download original image
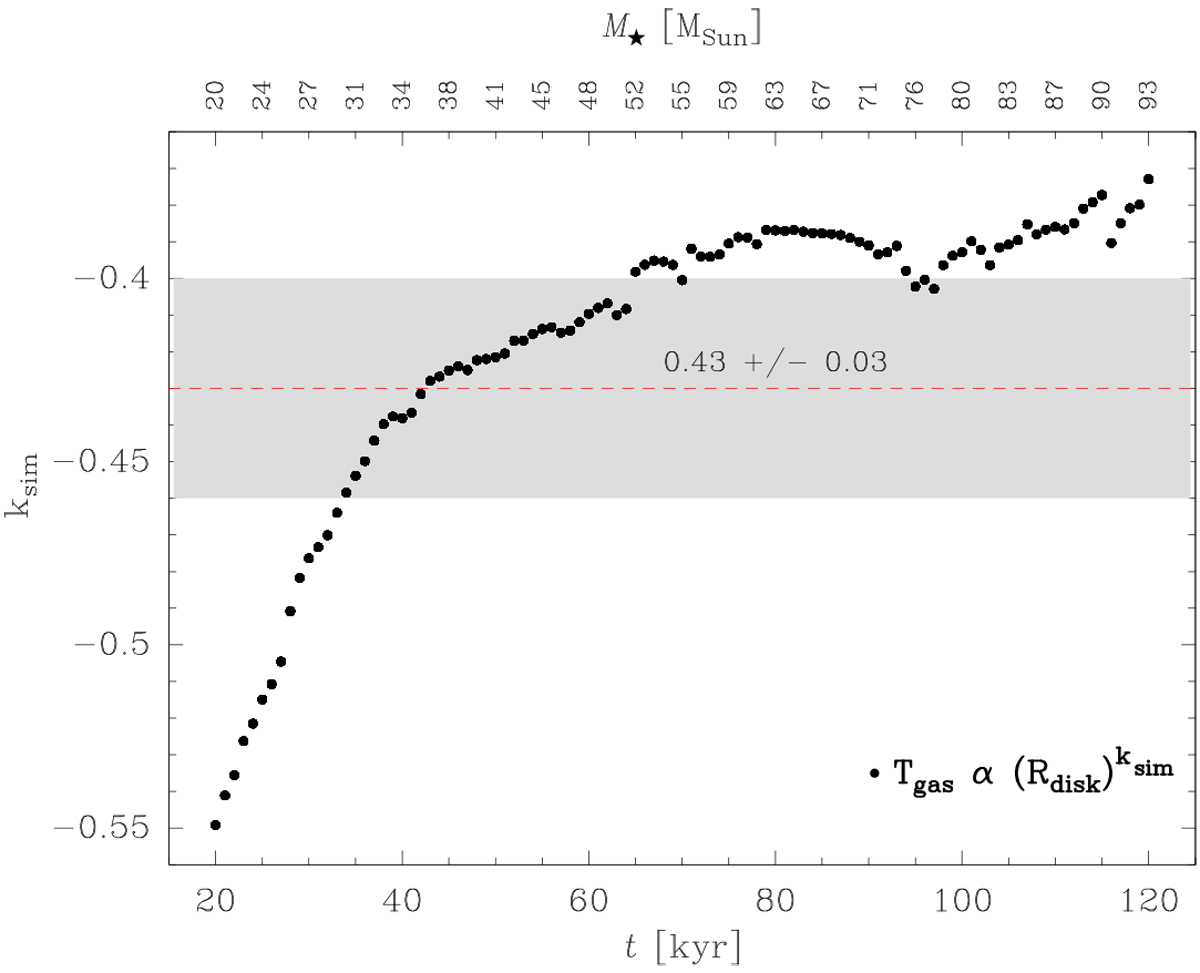
Variation of the temperature slope with time, as determined at the disk midplane of a massive star with the simulations by Kuiper & Hosokawa (2018, their Fig. 6), with the corresponding stellar mass indicated on top. The ksim is the meanlinear variation determined over the range of radii, 100–2000 au. The red dashed line marks the observed value fitted in the upper panel of Fig. 3, and the grey shadow defines the dispersion about the best fit (1σ).
Current usage metrics show cumulative count of Article Views (full-text article views including HTML views, PDF and ePub downloads, according to the available data) and Abstracts Views on Vision4Press platform.
Data correspond to usage on the plateform after 2015. The current usage metrics is available 48-96 hours after online publication and is updated daily on week days.
Initial download of the metrics may take a while.