Fig. 3
Download original image
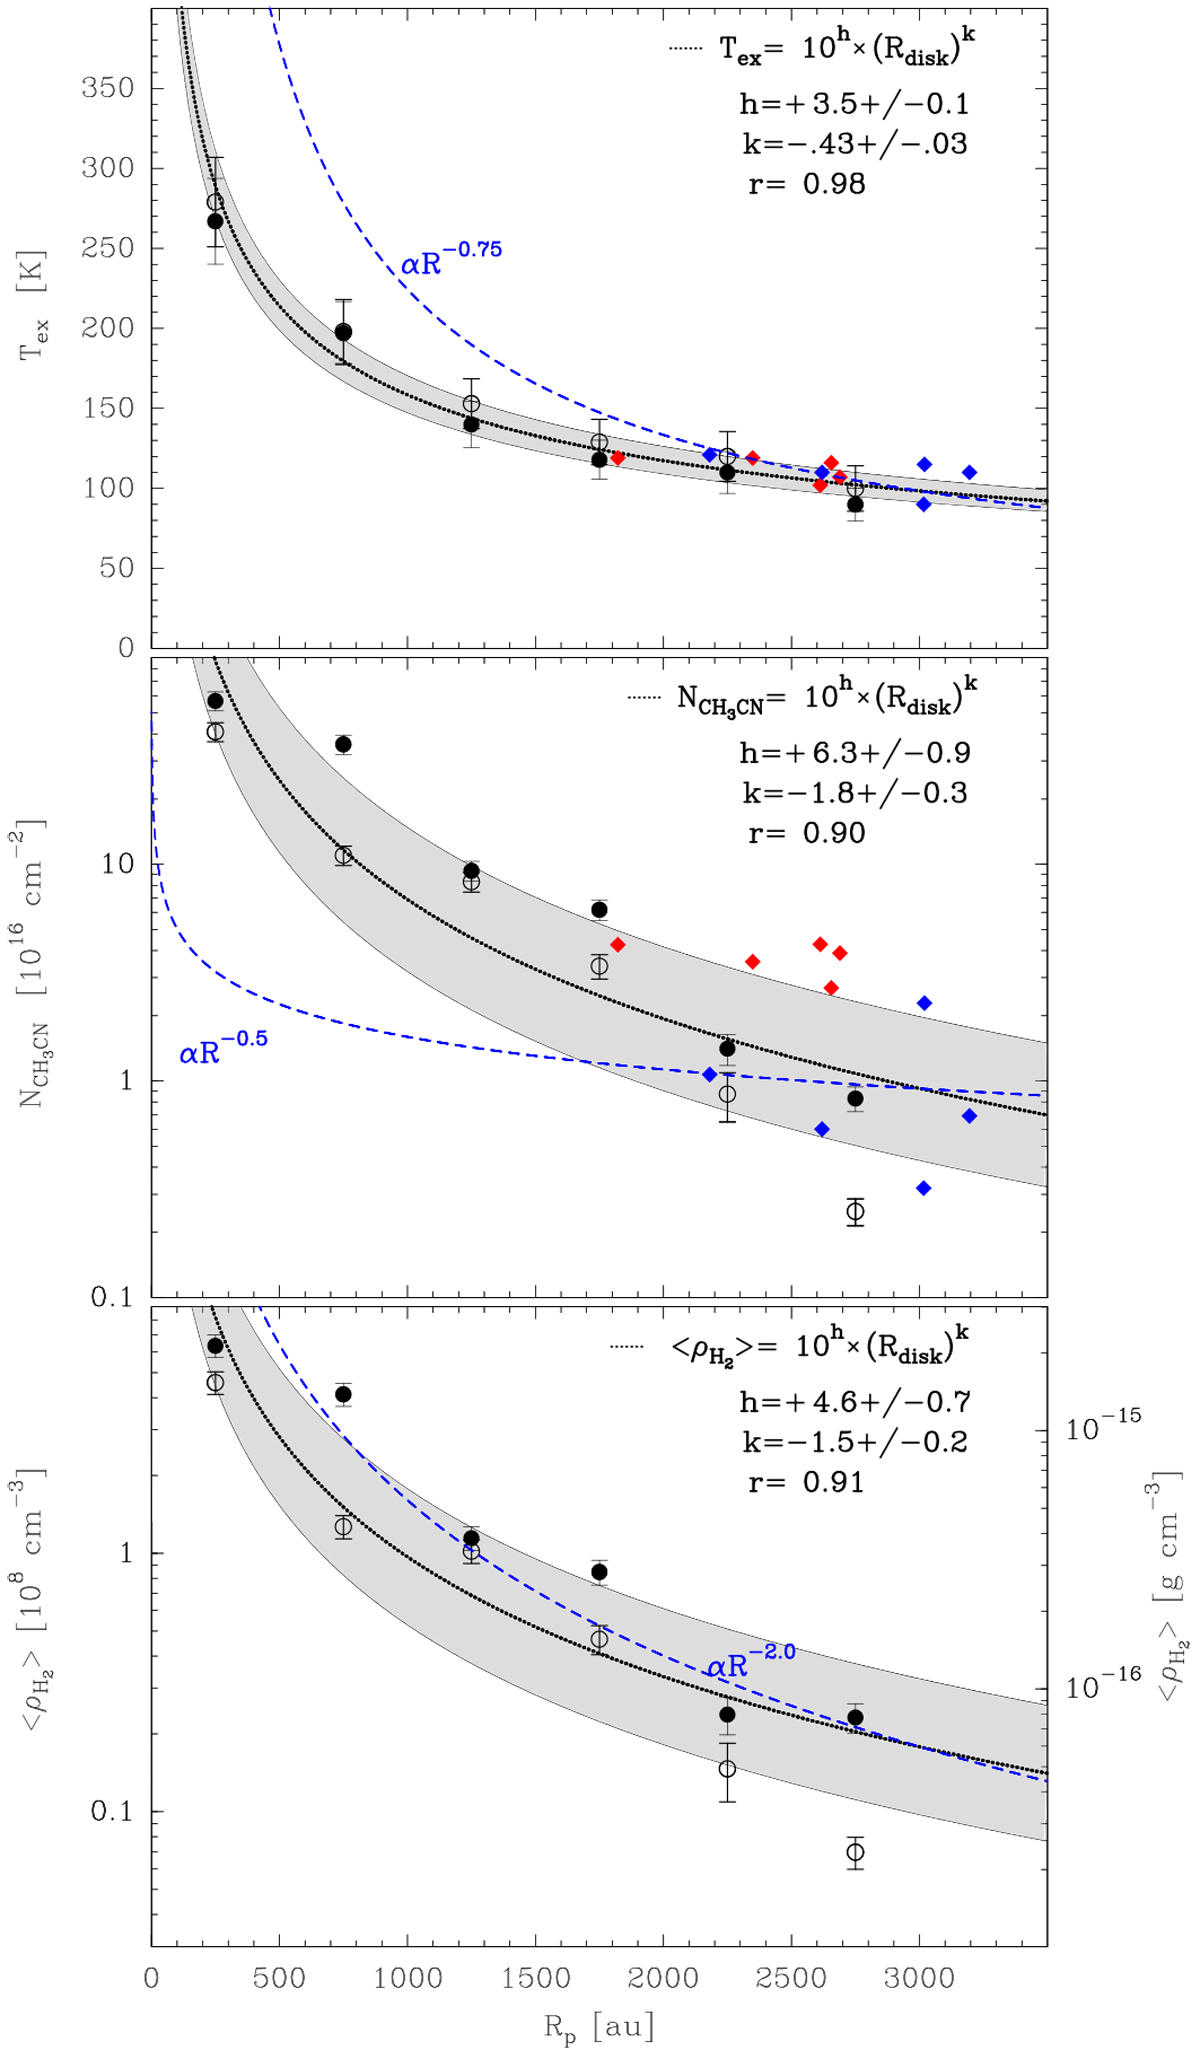
Dependence of the gas physical conditions with the projected distance from the star, as determined from the relative intensities of the CH3CN and CH![]() CN lines near 349 GHz. Filled and empty black circles mark measurements in the eastern and western disk sides, and red and blue diamonds mark measurements in the north-eastern ad south-western apparent spirals, respectively (Table 2). Error bars of (only) midplane measurements are drawn, which account for an additional 10% uncertainty due to the assumptions. Upper panel: temperature distribution along the disk midplane as a function of the projected distance from the star. The dotted bold line traces the χ2 fit to the sample distribution and the grey shadow shows the dispersion about the best fit (1σ). The best fit parameters and the linear correlation coefficient are indicated in the upper right. For comparison, the dashed blue line draws the increase of temperature with radius for a ‘classical’ power-law dependence (R−0.75). Middle panel: similar to the upper panel, but for the column density values. A logarithmic scale is used for the y-axis. Lower panel:similar to the upper panels, but for the H2 volume density averaged along the line-of-sight; this was calculated by assuming an edge-on disk geometry. The right axis provides the conversion to g cm−3.
CN lines near 349 GHz. Filled and empty black circles mark measurements in the eastern and western disk sides, and red and blue diamonds mark measurements in the north-eastern ad south-western apparent spirals, respectively (Table 2). Error bars of (only) midplane measurements are drawn, which account for an additional 10% uncertainty due to the assumptions. Upper panel: temperature distribution along the disk midplane as a function of the projected distance from the star. The dotted bold line traces the χ2 fit to the sample distribution and the grey shadow shows the dispersion about the best fit (1σ). The best fit parameters and the linear correlation coefficient are indicated in the upper right. For comparison, the dashed blue line draws the increase of temperature with radius for a ‘classical’ power-law dependence (R−0.75). Middle panel: similar to the upper panel, but for the column density values. A logarithmic scale is used for the y-axis. Lower panel:similar to the upper panels, but for the H2 volume density averaged along the line-of-sight; this was calculated by assuming an edge-on disk geometry. The right axis provides the conversion to g cm−3.
Current usage metrics show cumulative count of Article Views (full-text article views including HTML views, PDF and ePub downloads, according to the available data) and Abstracts Views on Vision4Press platform.
Data correspond to usage on the plateform after 2015. The current usage metrics is available 48-96 hours after online publication and is updated daily on week days.
Initial download of the metrics may take a while.