Fig. 2
Download original image
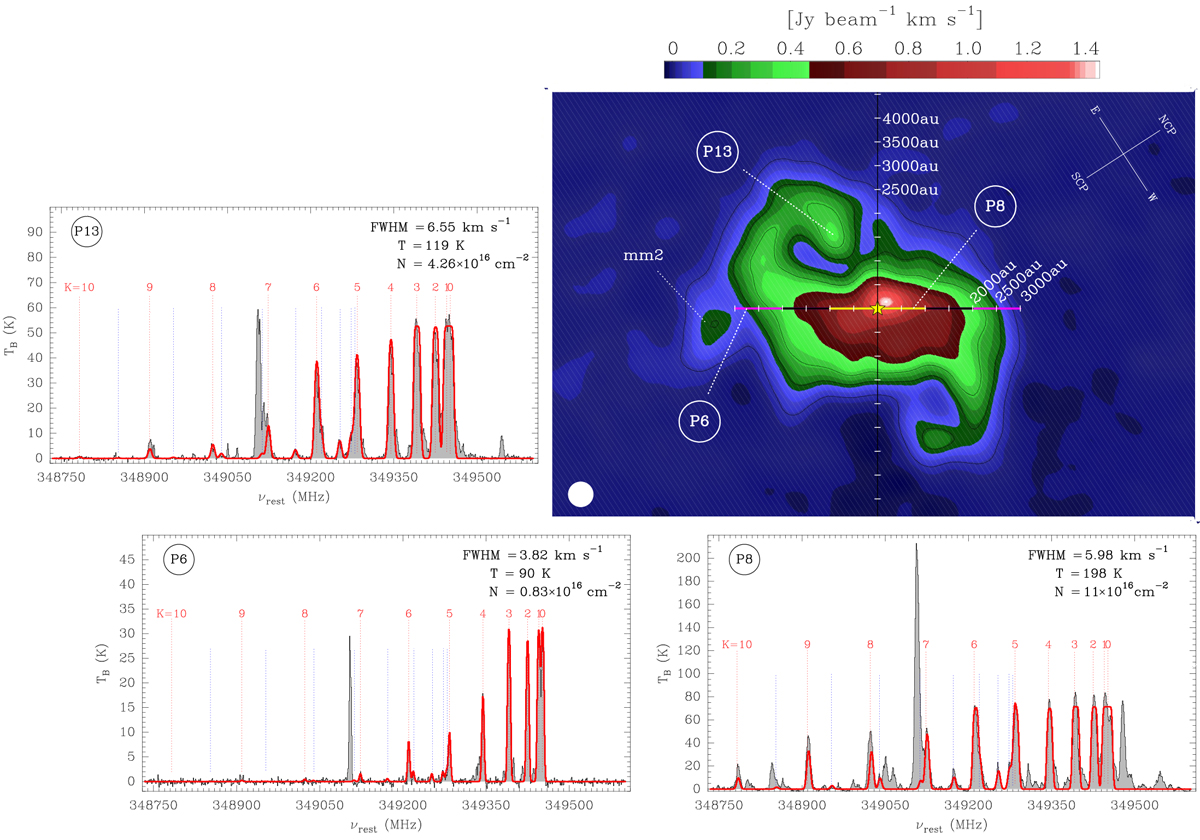
Physical conditions in the accretion disk of G023.01−00.41. Main panel: same image (and symbols) as in Fig. 1, with the equatorial reference system (top right) rotated clockwise by 57°, in order to align the (projected) outflow direction with the vertical axis of the plot. For three selected pointings indicated in white, we plotted the local integrated spectra at 349 GHz in the side panels (grey histograms), as an example of the molecular line profiles and fitting. The cluster source ‘mm2’ is marked; this source might alter the accretion disk around the primary (star symbol). Side panels: examples of different CH3CN (19K–18K) spectra extracted in the inner (P8), outer (P6), and apparent spiral regions (P13) of the accretion disk (identifier on the top left). Positions of CH3CN and CH![]() CN components are labelled in red and blue, respectively, with K ranging from 0 up to 10. The brightest line at a rest frequency of 349.107 GHz corresponds to the CH3OH emission imaged in the main panel; this line shows a bright maser contribution in the inner-region spectra (e.g. P8). Red profiles draw the synthetic spectra fitted with MCWeeds by a Monte Carlo Markov chains method, assuming LTE; the best fit parameters of intrinsic FWHM, excitation temperature, and column density of CH3CN are listed onthe top right (cf. Table 2). We note that the excess of emission visible in the higher K lines of the observed spectrum at position P8, with respect to the synthetic spectrum, is likely due to contamination from different molecular species.
CN components are labelled in red and blue, respectively, with K ranging from 0 up to 10. The brightest line at a rest frequency of 349.107 GHz corresponds to the CH3OH emission imaged in the main panel; this line shows a bright maser contribution in the inner-region spectra (e.g. P8). Red profiles draw the synthetic spectra fitted with MCWeeds by a Monte Carlo Markov chains method, assuming LTE; the best fit parameters of intrinsic FWHM, excitation temperature, and column density of CH3CN are listed onthe top right (cf. Table 2). We note that the excess of emission visible in the higher K lines of the observed spectrum at position P8, with respect to the synthetic spectrum, is likely due to contamination from different molecular species.
Current usage metrics show cumulative count of Article Views (full-text article views including HTML views, PDF and ePub downloads, according to the available data) and Abstracts Views on Vision4Press platform.
Data correspond to usage on the plateform after 2015. The current usage metrics is available 48-96 hours after online publication and is updated daily on week days.
Initial download of the metrics may take a while.