Fig. 1
Download original image
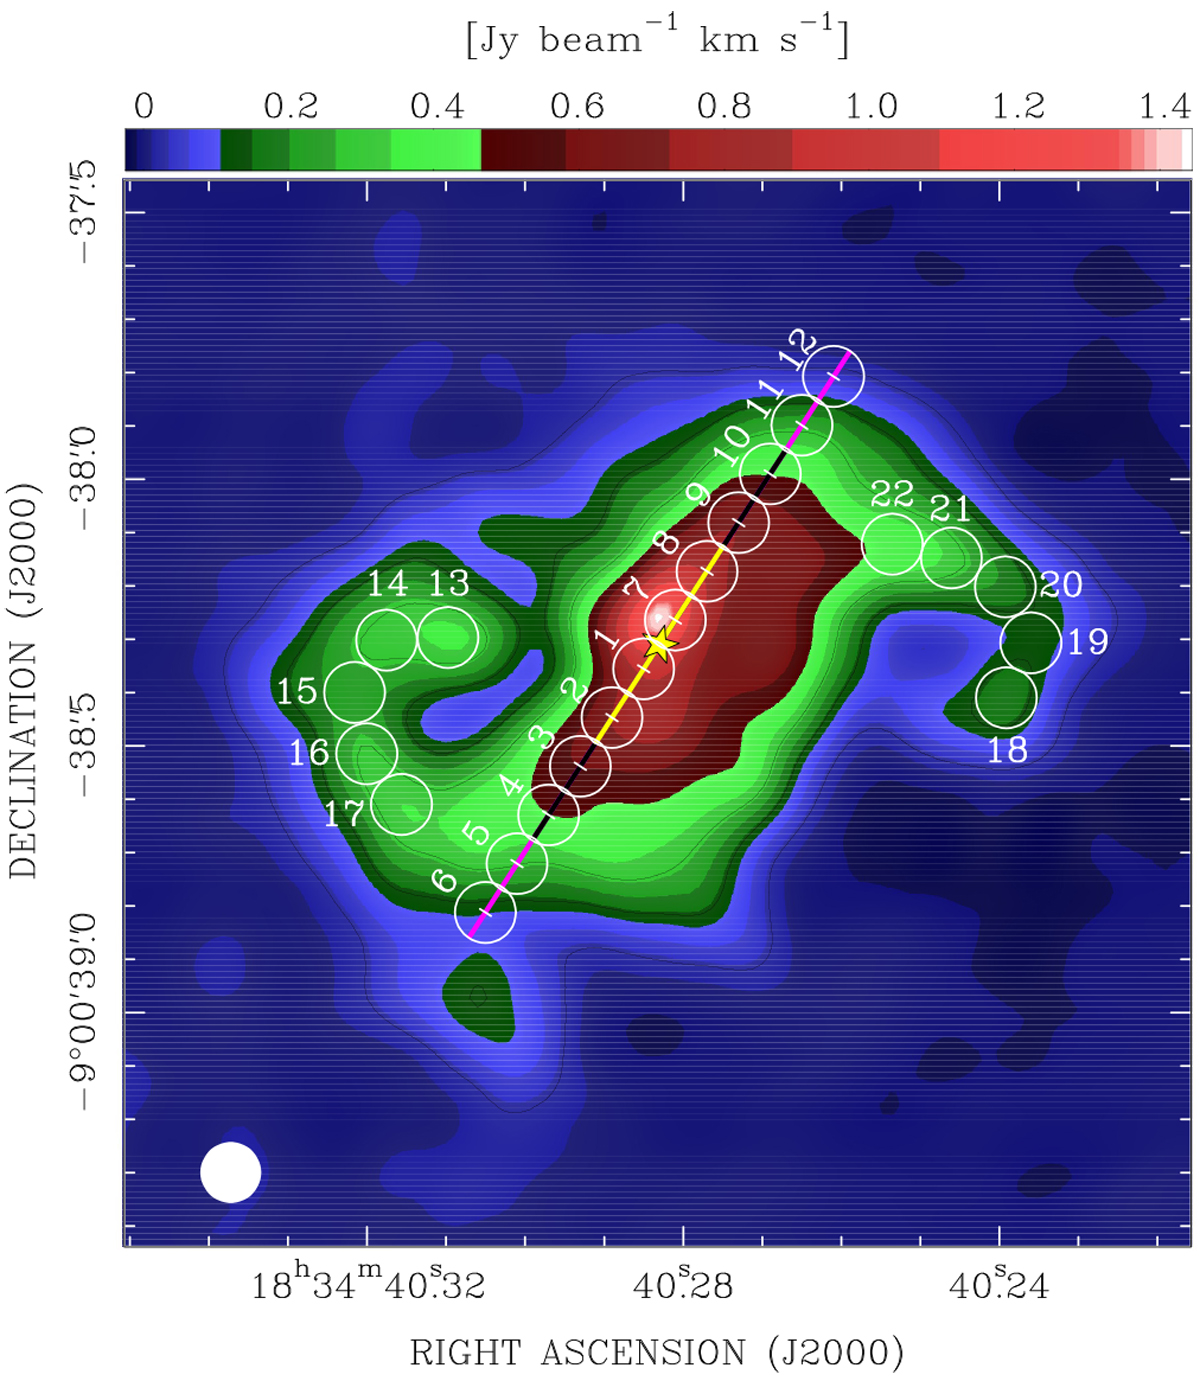
Spatial morphology of dense gas around the most massive star (star symbol) in G023.01−00.41: moment-zero map of the CH3OH (141,13–140,14) A+ emission (colours). The upper wedge quantifies the line intensity from its peak to the maximum negative in the map; black contours are drawn at levels of 10, 50, and 100 times the 1 σ rms of 2.8 mJy beam−1 km s−1. The disk plane, with white ticks at steps of 500 au, is drawn from the central star position at a position angle of − 33° (see Sect. 3). The synthesised ALMA beam is shown in the bottom left corner. White empty circles mark areas (hereafter, ‘pointings’) where the CH3CN spectra of Figs. A.3 and A.4 are integrated and are labelled from 1 to 22 (cf. Col. 1 of Table 2).
Current usage metrics show cumulative count of Article Views (full-text article views including HTML views, PDF and ePub downloads, according to the available data) and Abstracts Views on Vision4Press platform.
Data correspond to usage on the plateform after 2015. The current usage metrics is available 48-96 hours after online publication and is updated daily on week days.
Initial download of the metrics may take a while.