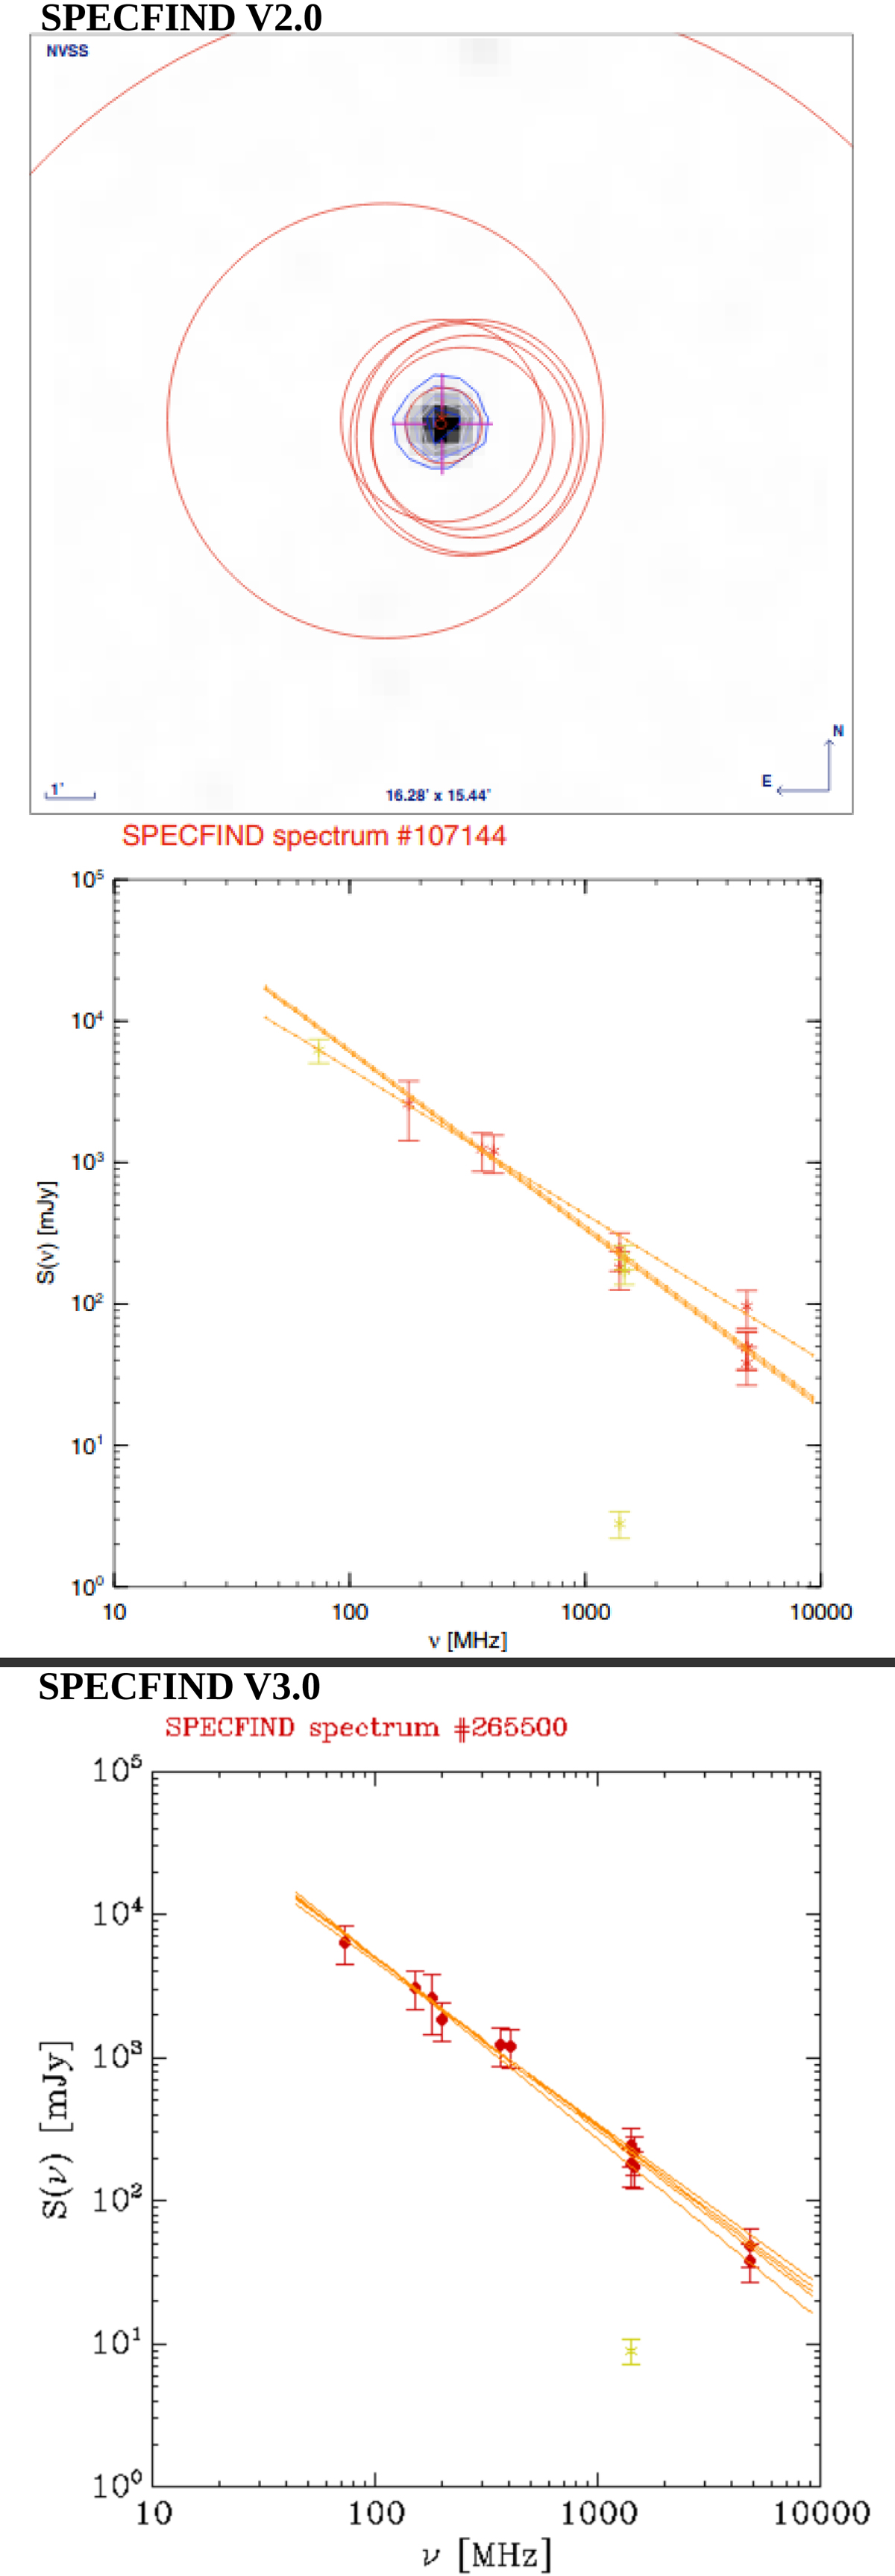
Fig. 6.
Download original image
Comparison of the resulting spectra of source TXS 2112+158 for SPECFIND V2.0 and V3.0. Top: NVSS grayscale and blue contours. Red circles are the beams of the catalogs included in the spectrum. Middle: SPECFIND V2.0 spectral fit. Bottom: SPECFIND V3.0 spectral fit. Yellowish green crosses have been discarded during the fitting process. Both versions show similar spectra with more sources included in version 3.
Current usage metrics show cumulative count of Article Views (full-text article views including HTML views, PDF and ePub downloads, according to the available data) and Abstracts Views on Vision4Press platform.
Data correspond to usage on the plateform after 2015. The current usage metrics is available 48-96 hours after online publication and is updated daily on week days.
Initial download of the metrics may take a while.