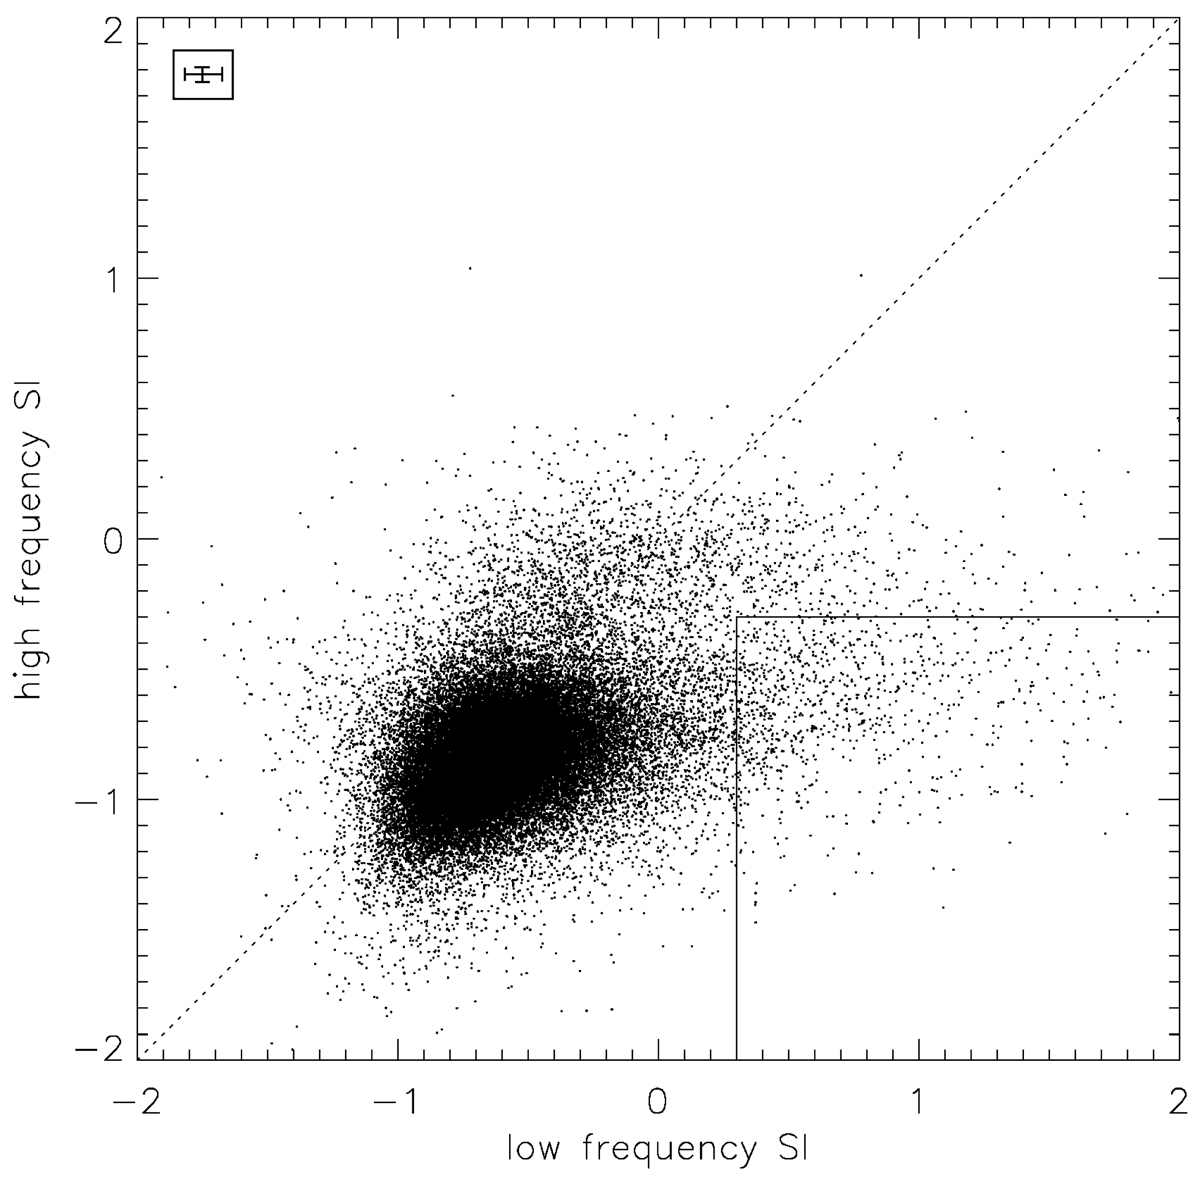
Fig. B.4.
Download original image
Spectral slopes of the subsamples with a frequency cut at 325 MHz, including 48535 sources with and without spectral breaks. The low-frequency spectral slope is on the x-axis, the high-frequency spectral slope is y-axis. The diagonal line is the one-to-one relation. Most of the spectral indices are slightly below the one-to-one relation. The entire sample shows a median and semi-inter-quartile-range (SIQR) value of the spectral slope of αhigh = −0.83 ± 0.24 on the higher-frequency part and αlow = −0.61 ± 0.31 on the lower-frequency part. The square marks the classification range of concave source candidates. In this region, 874 sources (327 concave and 547 MPS source candidates) are located. The mean error for all points is indicated in the upper left corner.
Current usage metrics show cumulative count of Article Views (full-text article views including HTML views, PDF and ePub downloads, according to the available data) and Abstracts Views on Vision4Press platform.
Data correspond to usage on the plateform after 2015. The current usage metrics is available 48-96 hours after online publication and is updated daily on week days.
Initial download of the metrics may take a while.