Fig. B.1.
Download original image
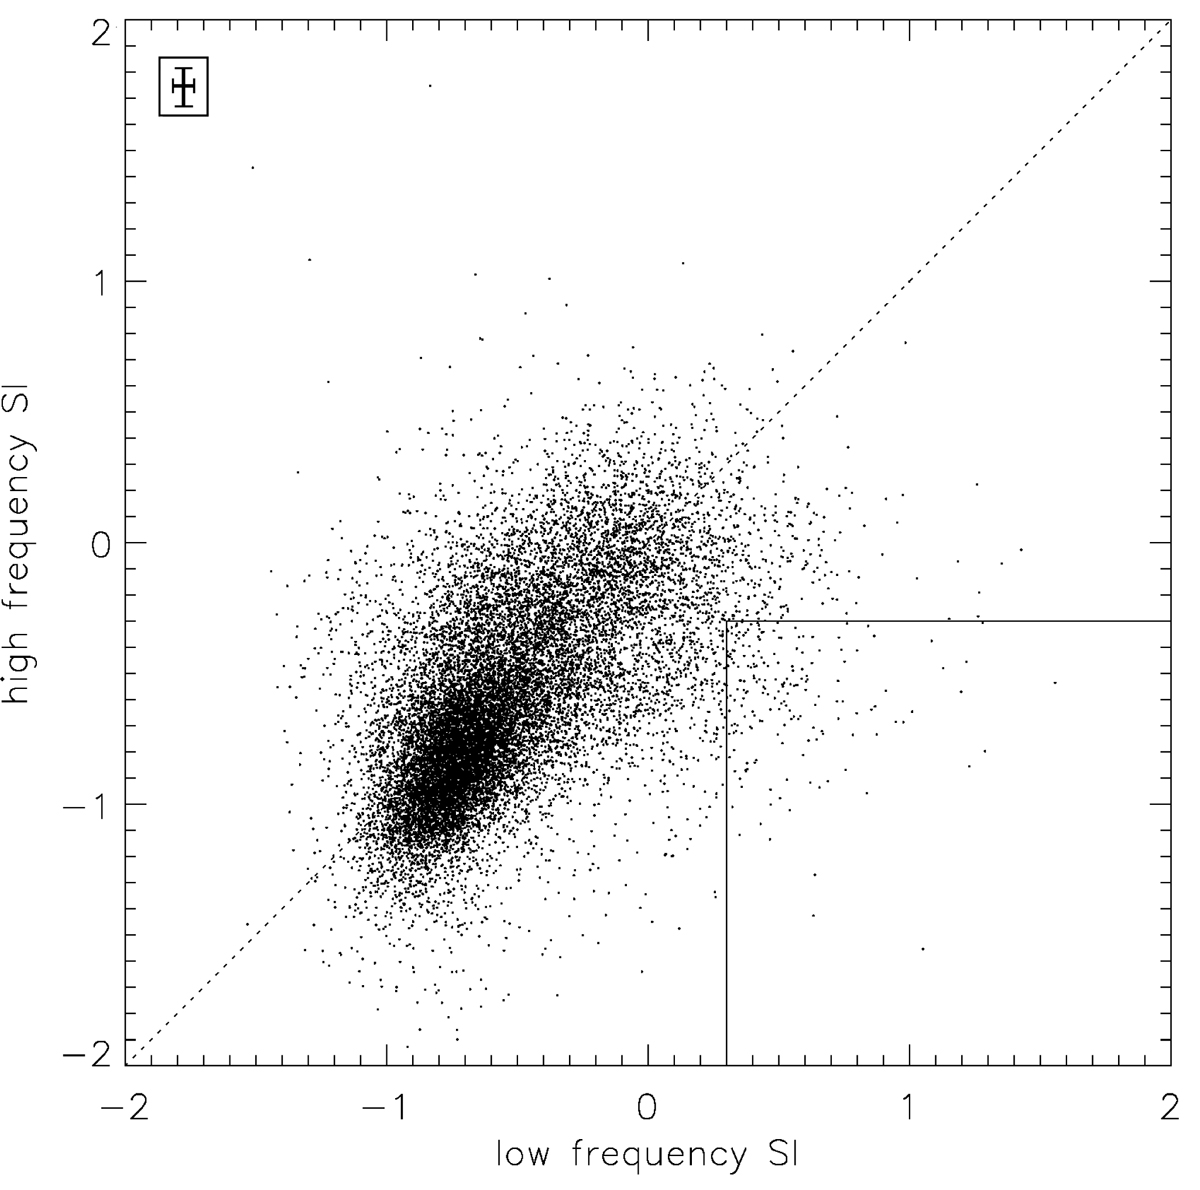
Spectral slopes of the subsamples with a frequency cut at 1.4 GHz, including 16 647 sources with and without spectral breaks. The low-frequency spectral slope is on the x-axis, the high-frequency spectral slope is on the y-axis. The diagonal line is the one-to-one relation. Most of the spectral indices are located around the one-to-one relation and thus the spectral slopes of both halves of the spectrum are consistent with each other. The square marks the classification range of concave and GPS source candidates. 196 sources (110 concave and 86 GPS source candidates) fall in this range. The mean error for all points is indicated in the upper left corner.
Current usage metrics show cumulative count of Article Views (full-text article views including HTML views, PDF and ePub downloads, according to the available data) and Abstracts Views on Vision4Press platform.
Data correspond to usage on the plateform after 2015. The current usage metrics is available 48-96 hours after online publication and is updated daily on week days.
Initial download of the metrics may take a while.