Free Access
Fig. 9
Download original image
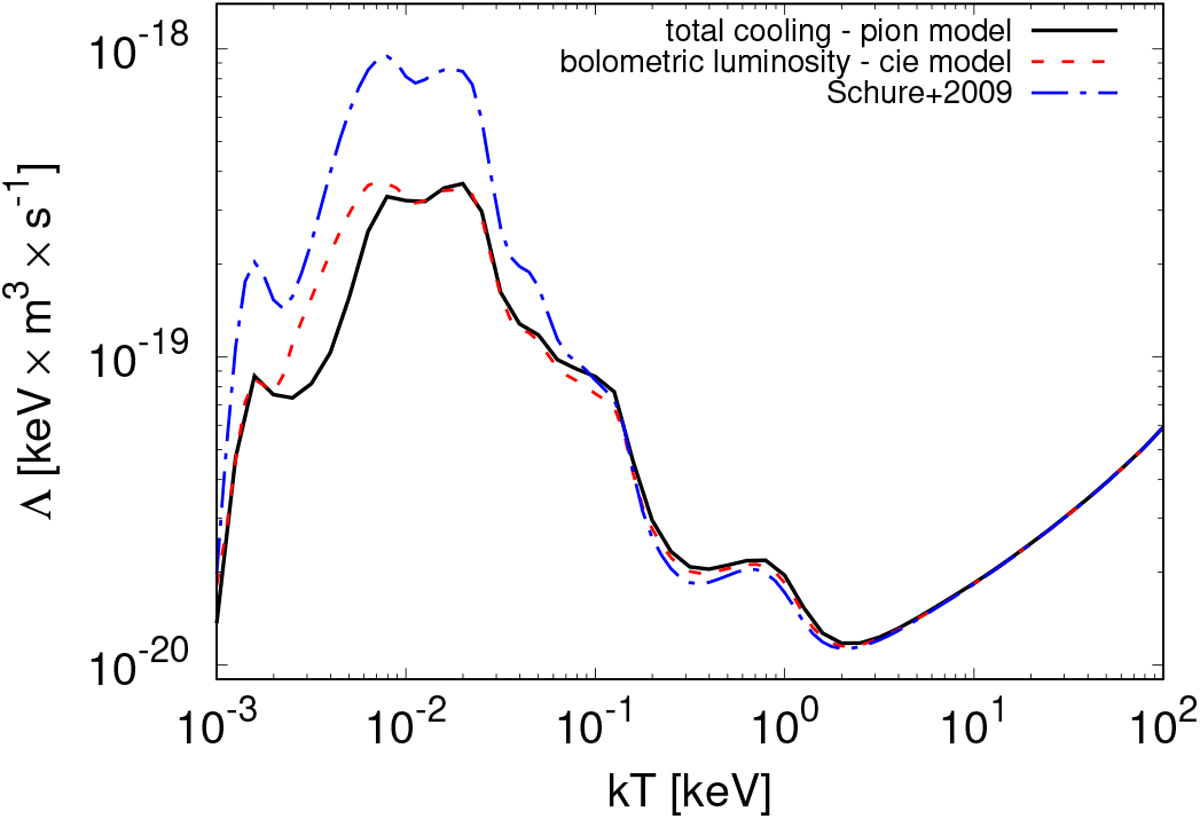
Comparison of the radiative loss curve obtained from Schure et al. (2009) (blue dash-dotted line), the radiative loss curve obtained from the cie model (red dashed line) in SPEX version 3.06.01, and the cooling curve obtained from the pion model (black solid line) in its CIE limit (zero ionisation parameter).
Current usage metrics show cumulative count of Article Views (full-text article views including HTML views, PDF and ePub downloads, according to the available data) and Abstracts Views on Vision4Press platform.
Data correspond to usage on the plateform after 2015. The current usage metrics is available 48-96 hours after online publication and is updated daily on week days.
Initial download of the metrics may take a while.