Fig. 12
Download original image
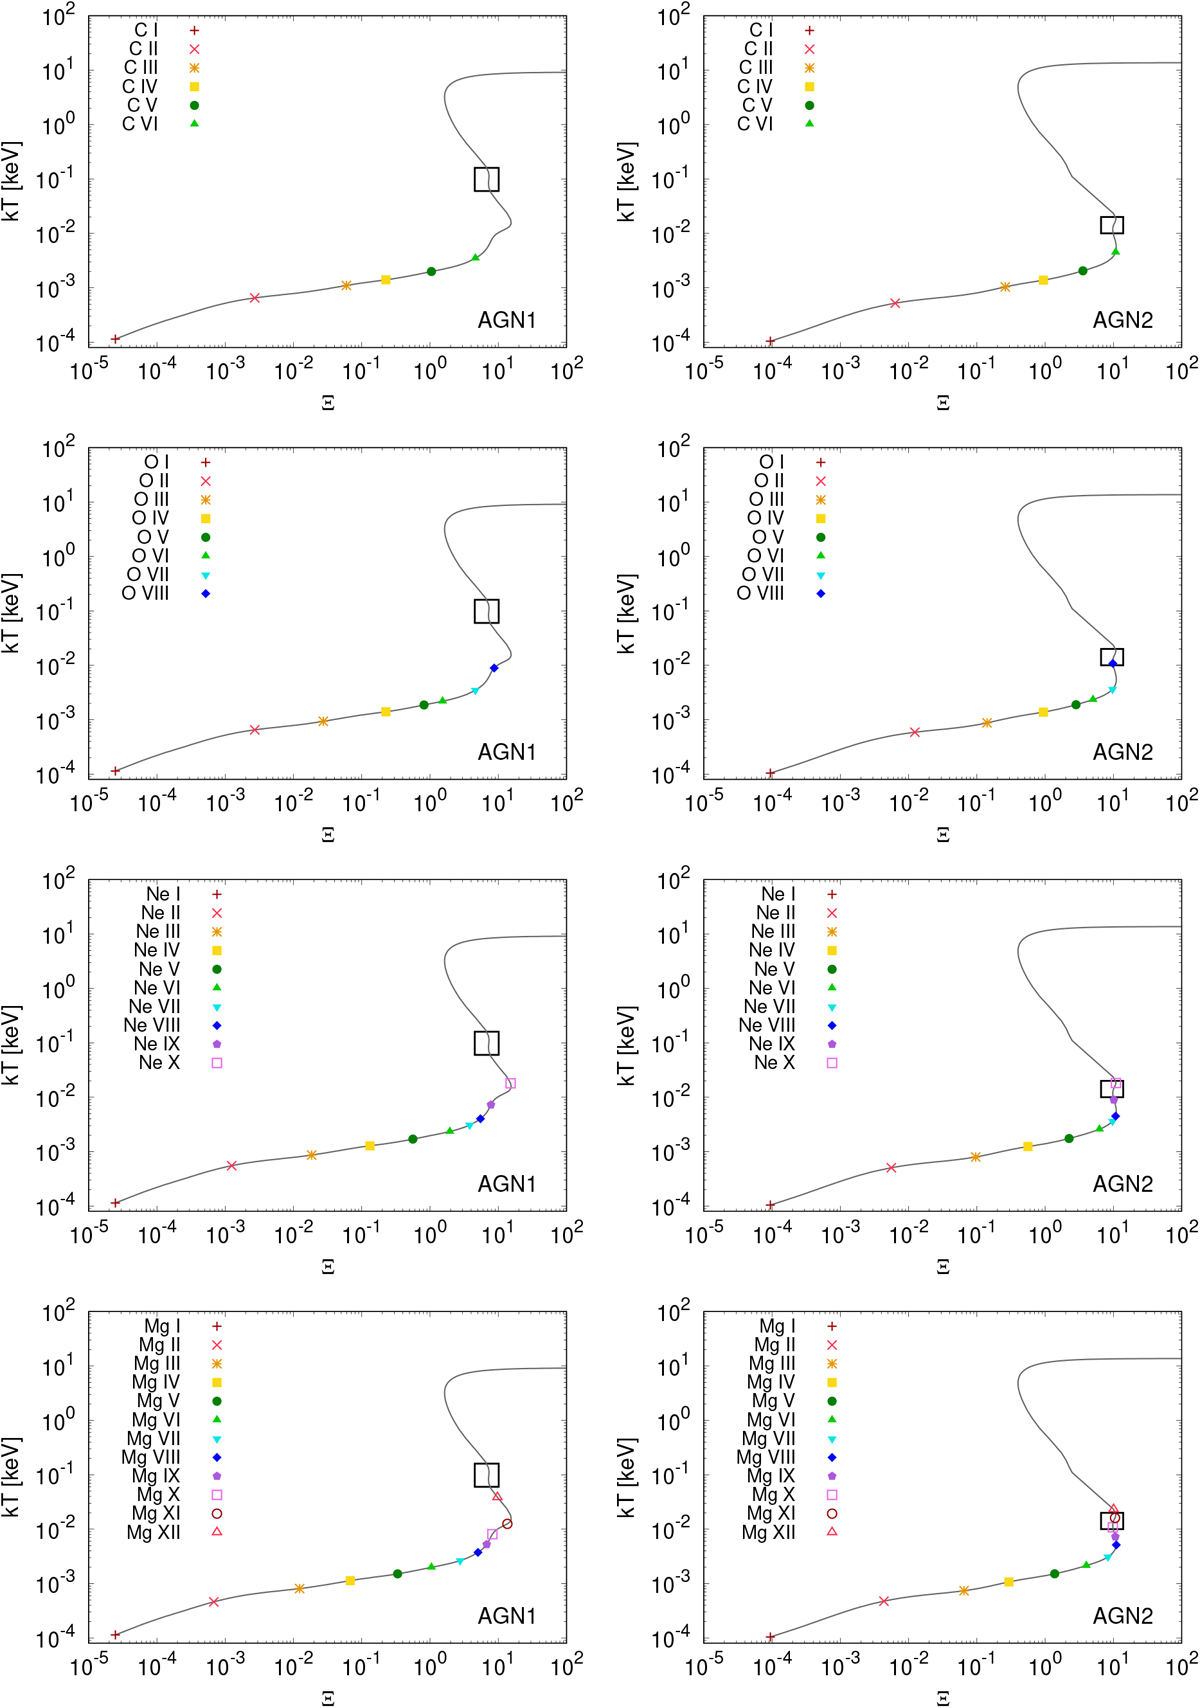
Stability curves for AGN1 (left panel) and AGN2 (right panel), with coloured points indicating the points in (kT, Ξ) phase space,where the column densities of C, O, Ne, and Mg peak. The rectangles represent new stable branches found after implementing the updates (described in this paper) to the photoionisation model pion in SPEX.
Current usage metrics show cumulative count of Article Views (full-text article views including HTML views, PDF and ePub downloads, according to the available data) and Abstracts Views on Vision4Press platform.
Data correspond to usage on the plateform after 2015. The current usage metrics is available 48-96 hours after online publication and is updated daily on week days.
Initial download of the metrics may take a while.