Fig. B.1
Download original image
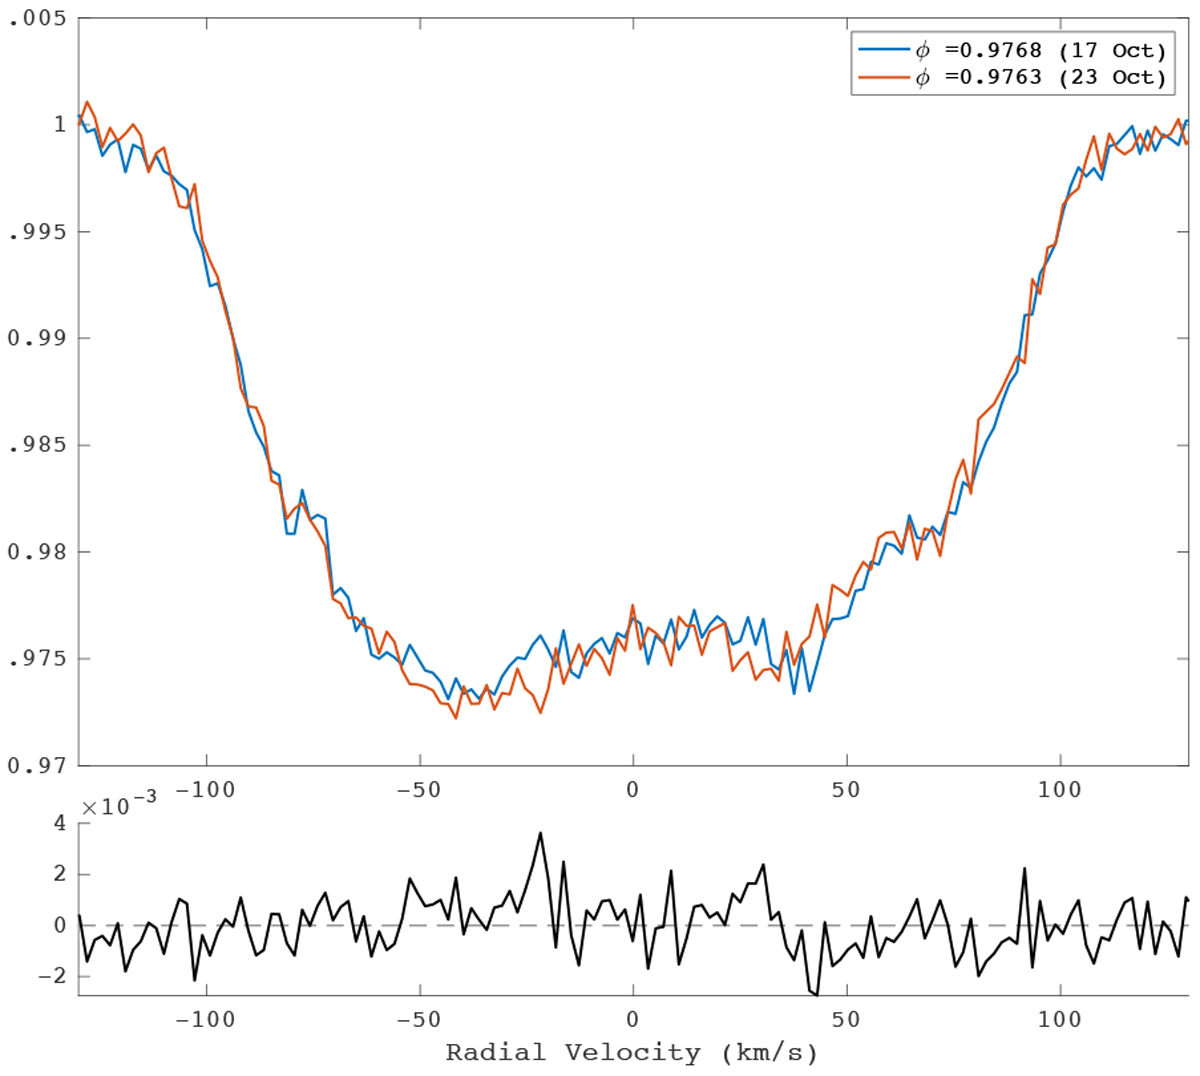
Top panel: example of LSD profiles for 17 Oct. (blue), and 23 Oct. (red) at close rotational phases (ϕ = 0.9768 and 0.9763). The small differences between the two profiles (e.g., at RV = −30 km s−1) are consistently observed in other couples and are mainly caused by latitudinal differential rotation. Bottom panel: difference between the two profiles.
Current usage metrics show cumulative count of Article Views (full-text article views including HTML views, PDF and ePub downloads, according to the available data) and Abstracts Views on Vision4Press platform.
Data correspond to usage on the plateform after 2015. The current usage metrics is available 48-96 hours after online publication and is updated daily on week days.
Initial download of the metrics may take a while.